Ready to reinvent growth? Let's connect.

New go-to-market sales strategy improves sales efficiency by 42%

Sales organization design case study

New go-to-market sales strategy improves sales efficiency by 42%

The challenge

Can growth continue with unfair sales coverage and missed opportunities?

Despite tremendous growth in the previous year, this SaaS company had seen large variations in the performance of their sales representatives with unfair territory coverage. Strong product-led growth left many loyal customer opportunities dormant. Here’s how Marketbridge helped design a more efficient go-to-market strategy that aligned sales motions with revenue potential and customer value for growth.

The objective

Diagnose and align to accelerate growth

The client’s objective was to gain a top-to-bottom analysis of their current sales strategy and highlight key areas of focus. This analysis would then be used to provide a framework to accelerate growth and scale effectively.

Through interviews with key stakeholders, it was observed that there was a lack of knowledge on how to market and communicate to customers beyond the end user. Additionally, there was a disconnect between the different players throughout the sales process, along with the sentiment that sales-led accounts could have been performing well above their current ARR.

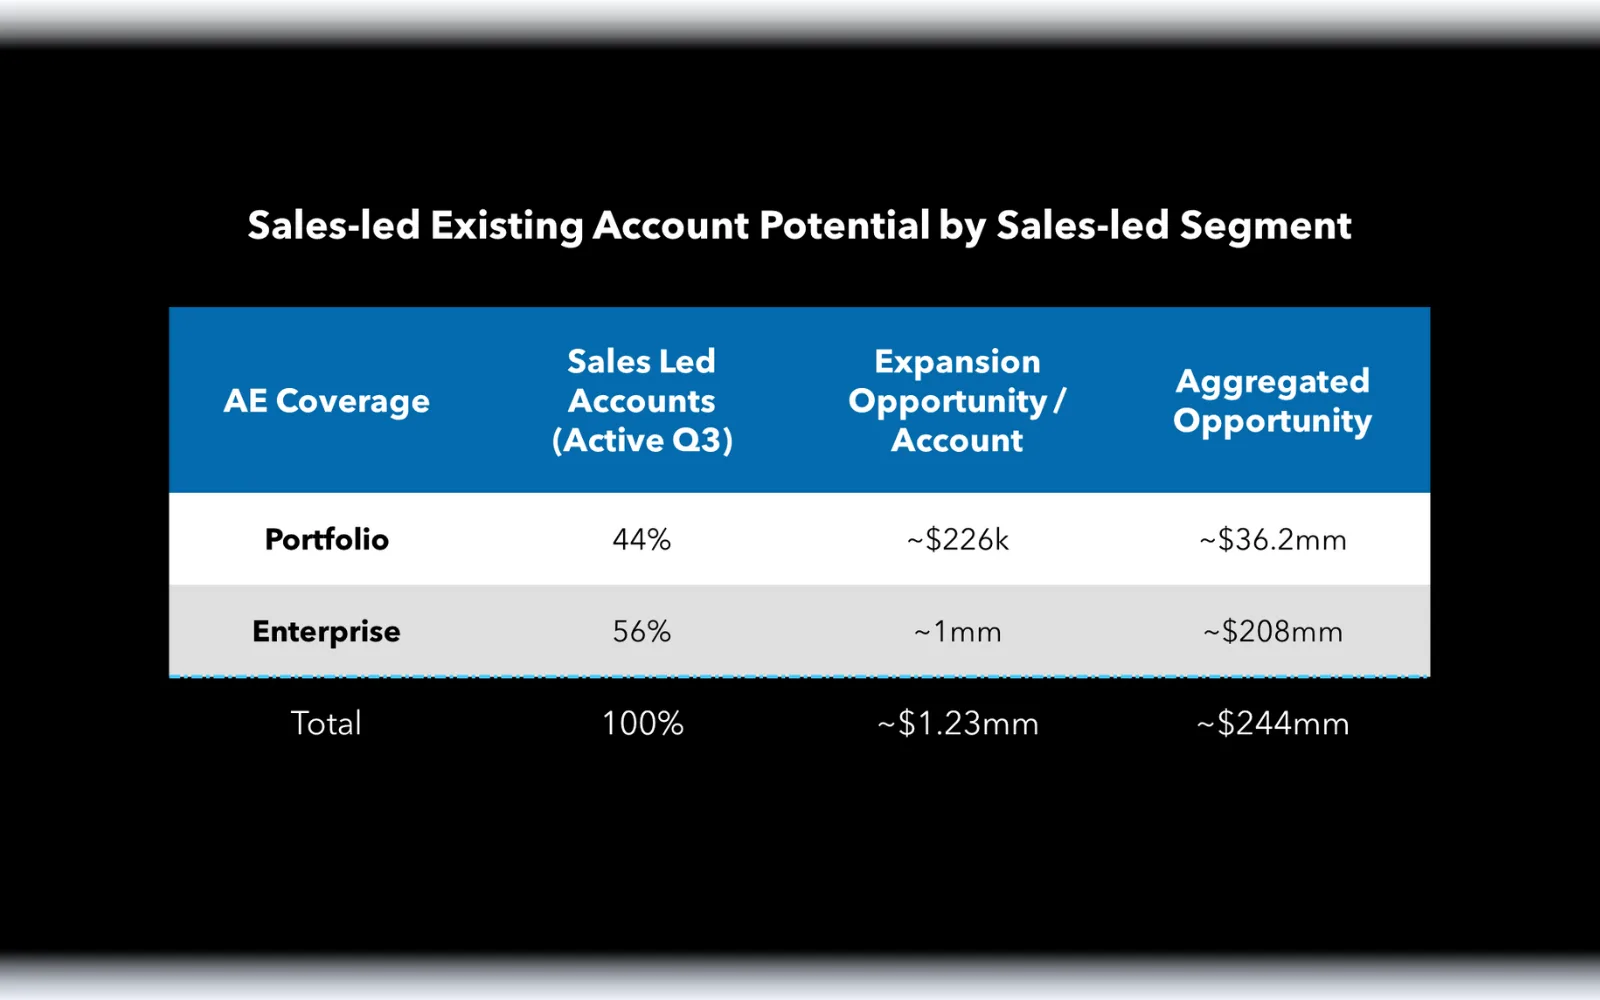
Key gaps were also observed in both current segmentation and coverage. A bifurcated segmentation model blurred the lines for account coverage, with 43% of accounts misaligned due to poor segmentation, and inconsistent role definitions created a lack of connection to revenue objectives and the sales cycle. With this information, our goal was to design and implement a revised go-to-market sales strategy, aligning revenue potential, customer value and sales motions to enable future growth.

The solution

Three steps to optimize roles, territories, and incentives

Step 1: Baseline assessment and strategy alignment

Marketbridge performed a baseline assessment of the current strategy and coverage structure. Customer segmentation, role definitions, territories, and marketing strategy were then analyzed. Significant gaps were found that needed to be addressed within each area of focus. Marketbridge identified three distinct sales plays that the client could utilize to enable future growth opportunities.

Step 2: Segmentation, role definition and coverage design

Using the information obtained in the baseline analysis, Marketbridge applied a data-driven approach to model opportunity at the account level—finding that ~75% of all ARR and opportunity fell within the top two deciles. This calculated information was then used to suggest alternative segmentations that could be aligned across roles and throughout the sales process. The new design also included updated role definitions, allowing for more specialization and deeper knowledge of the requirements. Marketbridge also recommended a reallocation of current accounts and a change in coverage design—considering time zones when allocating both existing and new accounts to ensure that resources could engage with clients consistently and influence future hiring strategy.

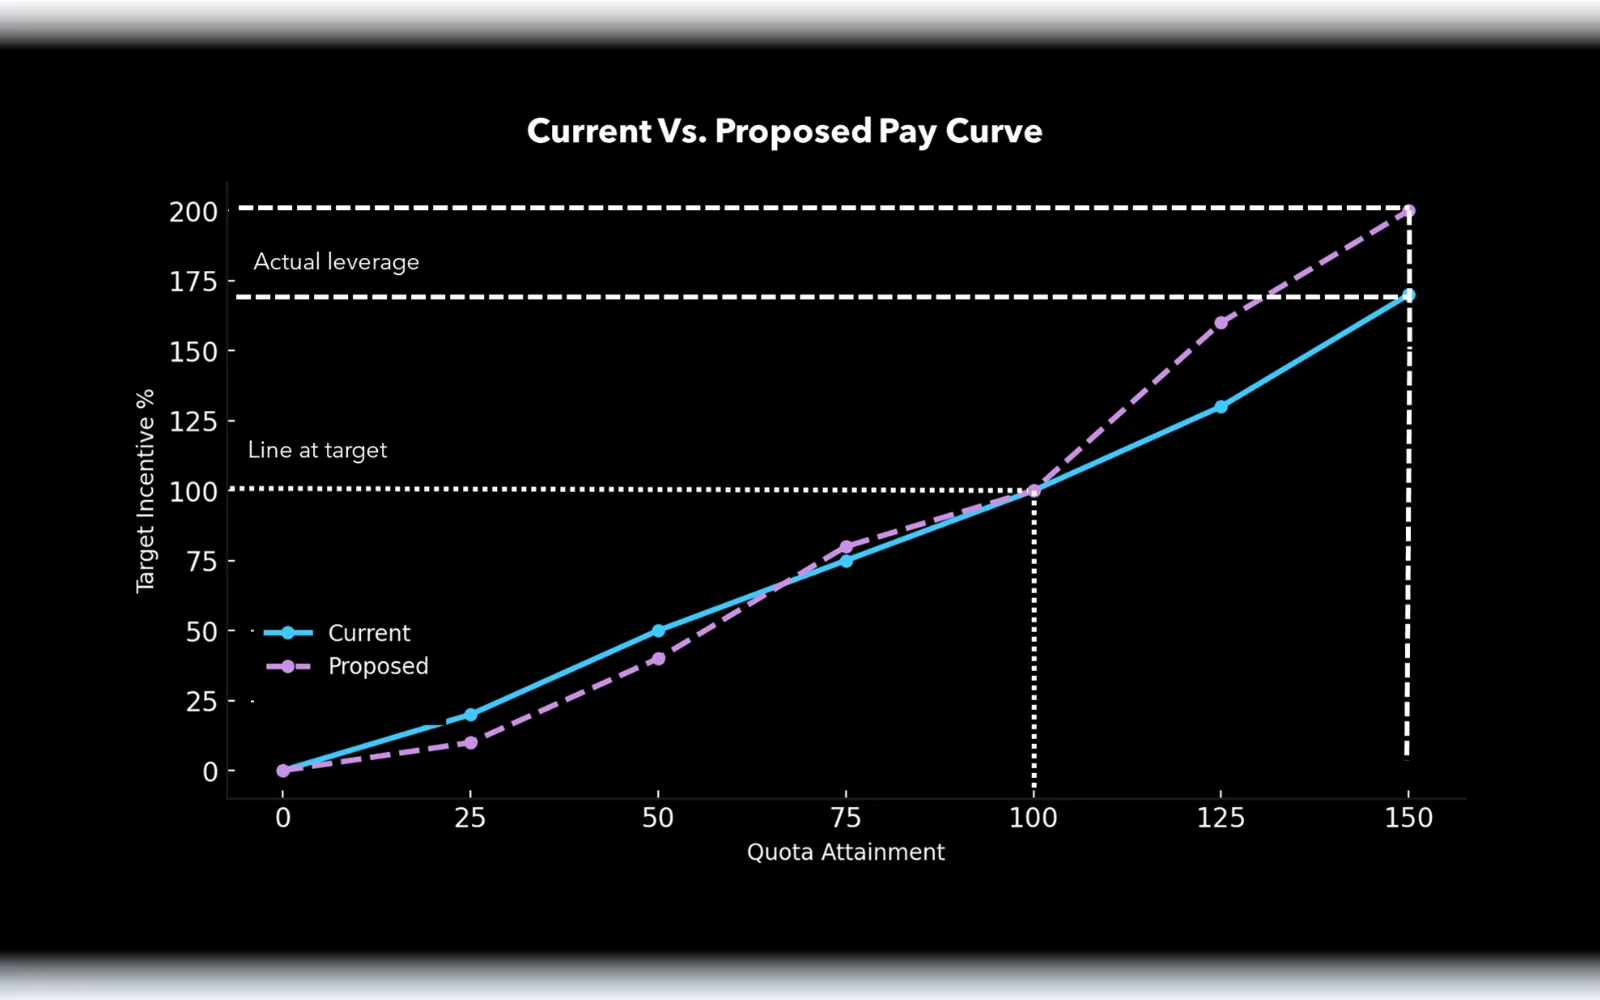
Step 3: Implementation of territory models, compensation and coverage design

These recommendations were translated into a driver-based financial model for the new fiscal year. The model incorporated channel economics to ensure a profitable and highly scalable approach to growth. It created new dynamic territories and more evenly allocated accounts across the Sales team. With this, the client could enable dynamic territories and optimize resource allocation over time. In addition, new sales compensation plans were outlined to pay for performance and align incentives with role requirements. Roles were then allocated across the sales cycle in a detailed coverage map that clearly defined each person’s role through each phase

Business impact

Primed for future growth

42% improvement in sales efficiency and target attainment

With the new account allocation, opportunity was evenly distributed across sales staff. This decreased expense to new bookings by 42% and allowed all sales staff to reach target ARR goals. Detailed roll definitions also improved connectivity and collaboration throughout the sales process.

Greater alignment of Sales and Marketing functions

Improved coverage structure helped align future sales plays and marketing efforts. This allowed both teams to communicate a consistent value proposition to both existing and potential customers. Consistent segmentation also reduced the number of misaligned accounts to 0, allowing for more collaboration across all departments and roles

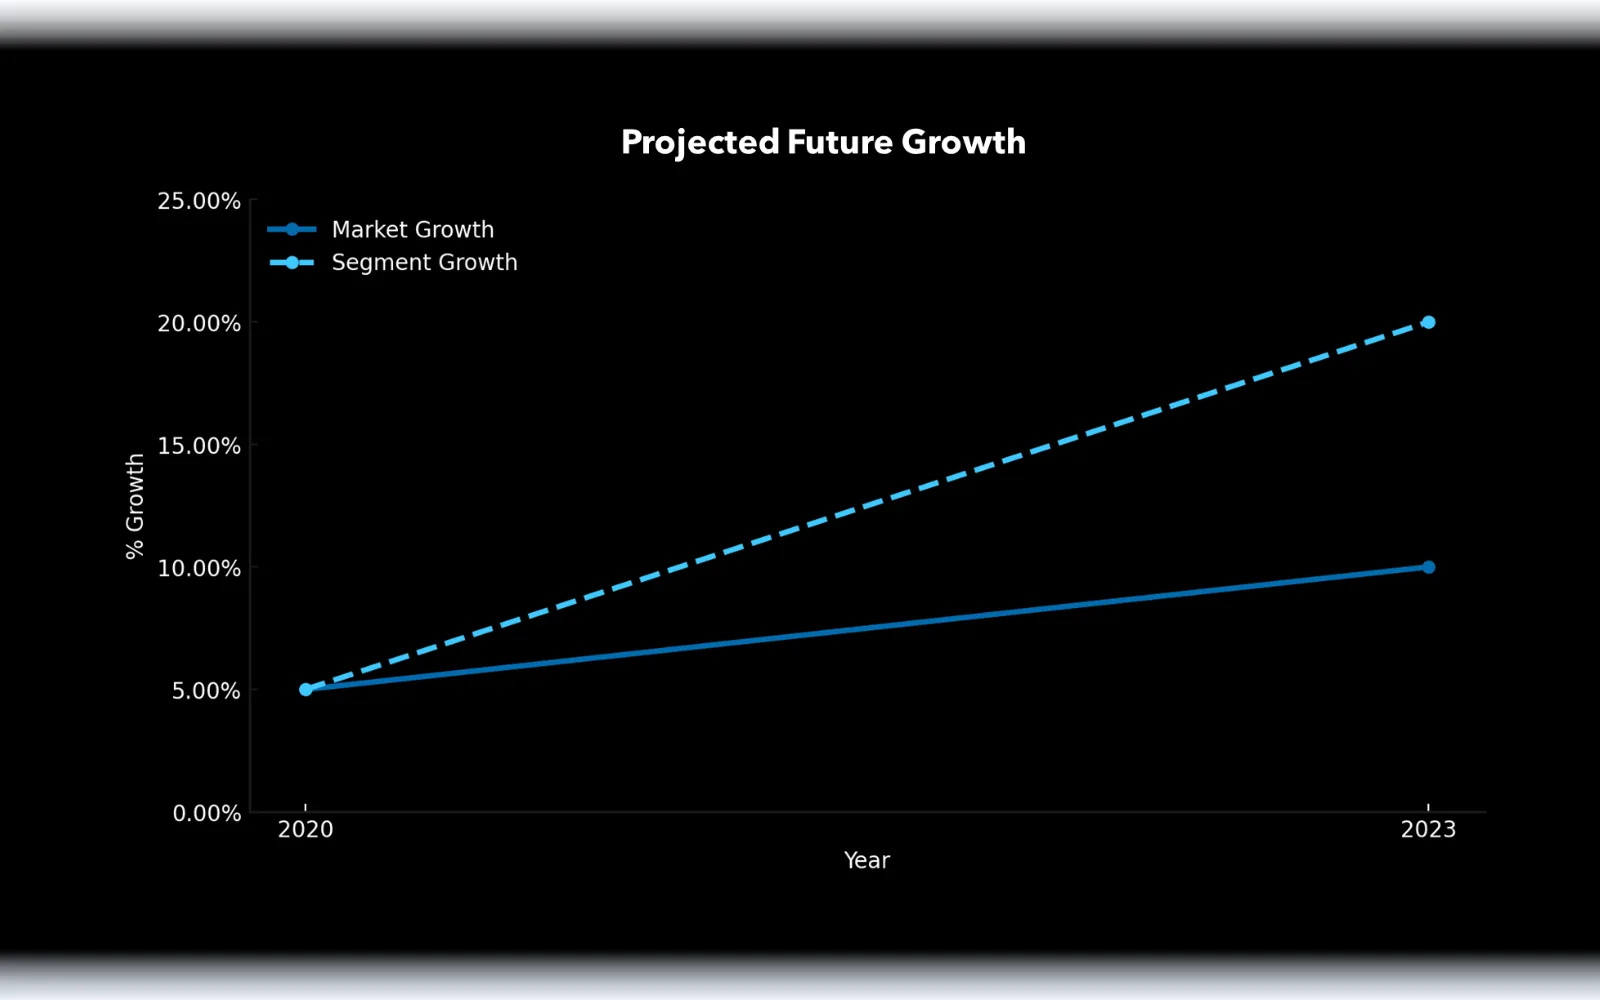
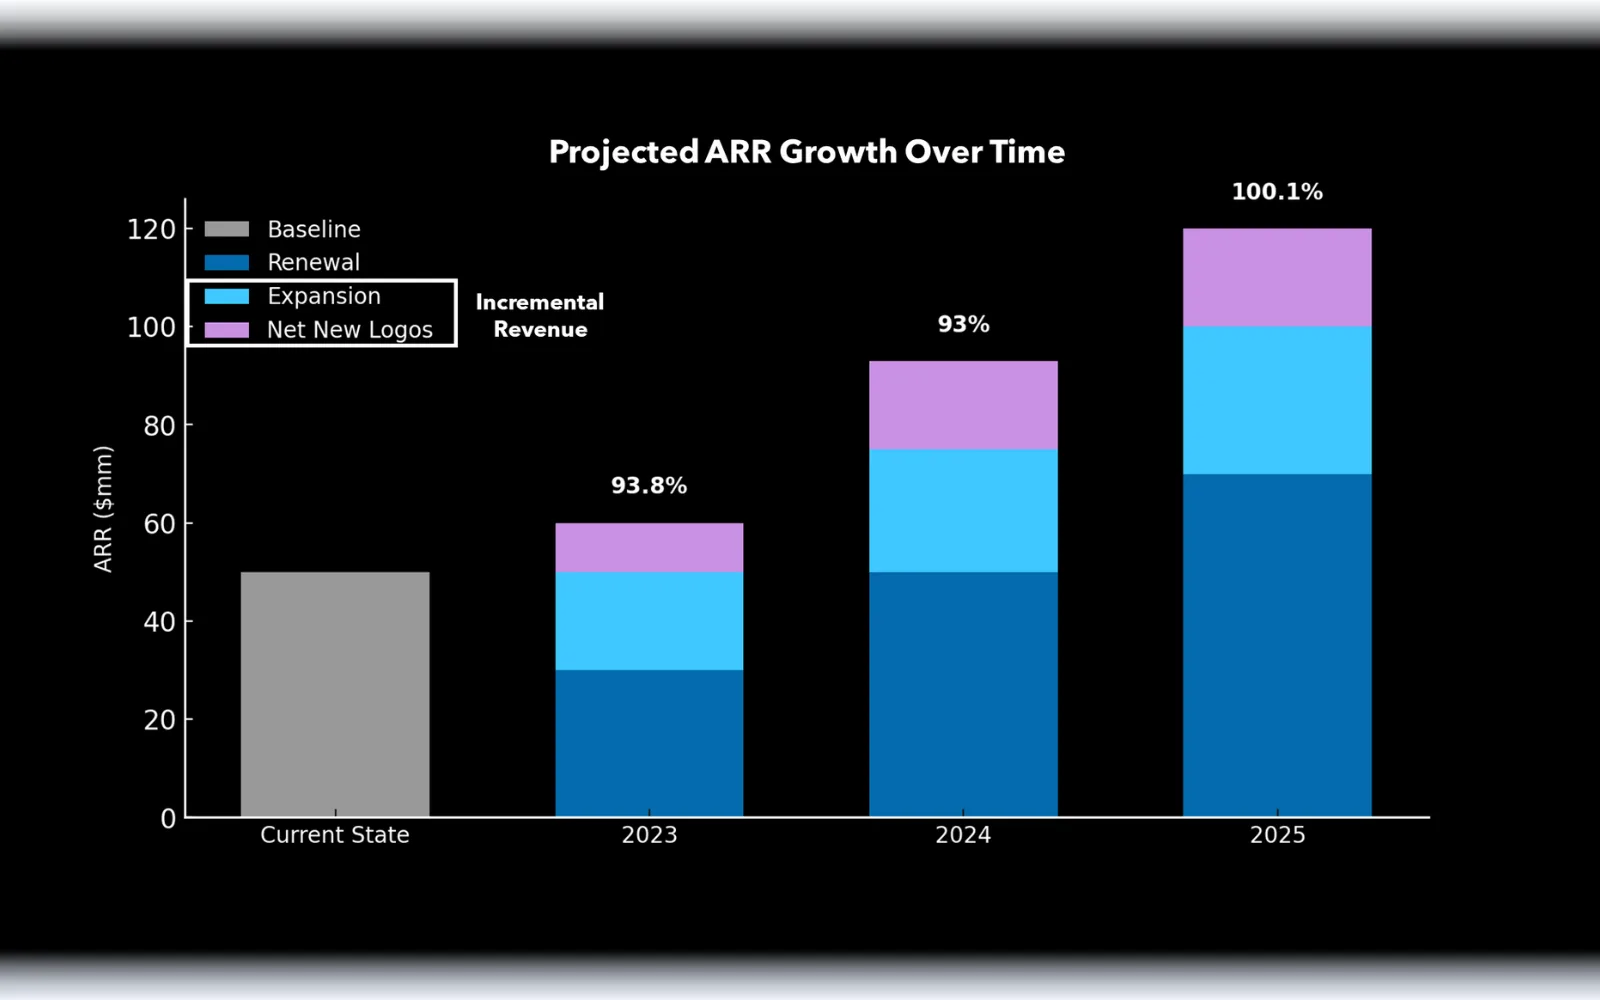
Scalable go-to-market strategy 
for ARR growth

Our implementation has influenced a net ARR increase of 130%. New dynamic territories created by the model enabled the client to distribute new accounts across the Sales team effectively as their customer base grew. This more efficient allocation of resources ensures consistent customer engagement and can adapt, continuing to promote revenue growth.

Optimizing member outreach campaigns improves health outcomes

Marketing effectiveness case study

Optimizing member outreach campaigns to improve health outcomes

The challenge

How does marketing impact member health?

Quality member care is a crucial part of the long-term success of healthcare payers. Better member health outcomes mean healthier members, lower medical costs, less member disenrollment, improved Medicare Advantage star ratings, and bonus government reimbursements. 

A Fortune 50 healthcare payer invested hundreds of thousands in outreach campaigns that asked targeted members to complete certain preventive screenings, aiming to improve overall member health outcomes. However, the ability to measure the effectiveness of these marketing campaigns was a challenge.

There were two main pain points. First, the campaigns consisted of multiple touchpoints across offline (direct mail, phone calls) and online (digital media) channels, making it hard to determine which tactics were driving preventive screenings. Second, the long-tail response curves of these campaigns and the time it took to receive claims data meant months of delay for analysis and optimization.

The objective

Optimize measurement efforts

This Fortune 50 healthcare payer wanted to develop a measurement plan to achieve three main objectives. 

Determine Campaign Effectiveness

Are certain marketing campaigns effective in persuading members to take a test, get a screener or engage in other health outcomes?

Segment the Market

Which patient segments are responding to which marketing tactics and how do we capitalize on each using data? 

Driving Continuous Improvement

How can the client infuse timely data-driven learnings into ongoing marketing cycles for continuous testing & learning?

The solution

Concurrent modeling and testing approach to measurement

Marketbridge solves the toughest marketing and sales challenges using quantitative, reproducible methods—and we have a history of helping healthcare leaders succeed in a crowded marketplace by optimizing channel coverage, personalizing the purchase experience, and measuring which marketing channels are driving results across the buyer journey. To accomplish this project, we leveraged all our experience and recommended a two-part measurement approach.

Build a Multi-touch Attribution (MTA) Model

A multi-touch attribution model (MTA) assigns fractional credit to each touchpoint in the gap closure campaigns. This allows the marketing team to see how much influence each channel has on a given member action.

Over the long-term, this type of member-level response analysis enables the marketing team to make marketing mix decisions across different member segments. 

However, while an MTA model may at first seem to be an optimal solution, the response variable (in this case a member claim) takes several months to mature.  

A response requires a member to schedule and attend an appointment, and the claim data has a time-lag. In this case, the long lead-time meant the model results would not be available until after the next year’s campaign planning.

To account for this delay,  Marketbridge proposed pairing the model development with a Randomized Controlled Trial (RCT).

The RCT analysis proved that three out of four campaigns were successful in driving an incremental lift in gap closures. These timely results allowed the marketing team to optimize spend toward the three campaigns that were working, and bought time to “retool” the unsuccessful campaign for testing in a future campaign cycle.

As for the MTA model, the overall long-term results validated the findings of the RCT analysis and proved that most of the marketing campaigns were working.  

However, to gain even more insight into how to best optimize marketing spend, Marketbridge applied an existing propensity model to campaign responders to see if marketing’s impact varied by a member’s “likelihood to close a care gap.” By looking at the results in this way, the payer learned the cost to market to each segment. As expected, members with a higher likelihood to close a care gap had overall lower cost-per-incremental-closure versus members with a low likelihood to close a care gap.


Business impact

Brand campaigns targeted at the right people led to improved marketing ROI

With our insights and recommendations, the client was able to increase their marketing ROI and optimize their budget to best improve overall member outcomes

Optimized Marketing Spend

Results showed that members with a higher likelihood of closing a care gap had lower cost-per-incremental-closure, leading the marketing team to streamline efficient outreach.

Improved Member Health Outcomes

The marketing team proved the impact of targeted care gap campaigns on preventive screenings, improving member health outcomes.

Timely Test and Learn Cycles

An RCT approach enabled the marketing team to work around long-tail response curves to build data-driven campaigns for year-round learning and optimization of marketing outreach.

Building a simple, actionable, measurable brand model

Marketing effectiveness case study

Building a simple, actionable, measurable brand model

The challenge

What is the link between marketing, brand and sales?

A premium personal care brand wanted to quantify brand strength to understand which marketing efforts and strategic initiatives moved the needle, and to reveal the relationship between brand and sales.

Awareness was trending up while share of voice was dropping, product reviews had never been better while new customer acquisition was declining.

These mixed messages made it difficult to evaluate the relationship between a recent brand campaign and the brand itself, let alone the linkage to revenue. 

The objective

Build a data-driven understanding of brand impact

Marketbridge set out to coalesce the company’s variety of brand data sources into a set of simple, actionable and clear brand metrics. With a time-series view of these metrics, we then reviewed the impact and temporal lag of marketing and PR efforts. 

The solution

Create a holistic brand model to assess sales impact

Part 1: Build a Brand Factors Model

We gathered all data that might be either an indicator or a driver of brand strength by meeting with data owners and analysts across the company.

After normalizing the data and aligning time granularity (daily vs. monthly, etc.), we used Structural Equation Modeling, paired with our deep understanding of the business, to test hypotheses and generate a model of the unobserved factors that comprise the client’s holistic brand.

After multiple iterations and brainstorming sessions, we landed on a model with three factors, turning over a dozen sources into a simple 3-part view:

(A) Awareness

Are potential customers in the company’s target demographic aware of (a) the premium personal care category and (b) the brand itself? 

(B) Affinity

Do those customers who have experienced the brand, whether as a buyer or a simple observer, view the brand and its products favorably? 

(C) Salience

When potential customers are talking about the premium personal care industry, are they talking about our client’s brand or their competitors?

Part 2: Review Brand Factor History and Tie to Sales Trend

Armed with the three-factor brand model, we plotted the brand over multiple years and pointed to specific moments in company history, noting the effect on each factor.

PR struggles, competitor investments and marketing campaigns all had predictable impacts on Awareness, Affinity and Salience, though the impacts were far from uniform: 

(A) Awareness

The company was in a growing category with lots of social “buzz.” As an incumbent, increases in category awareness translated into brand awareness, so we saw an ever-increasing Awareness factor. 

(B) Affinity

Our Affinity factor moved up and down in line with PR moments (good and bad) and paid media spend. It was clear that a recent campaign had helped Affinity to rebound. 

(C) Salience

The client’s Achilles heel was the Salience factor. Metrics like share of voice and search volume all pointed towards competitors continuing to build audience momentum at the company’s expense. 

Business impact

Re-oriented media budget towards category salience

Critically, the company’s salience factor appeared closely intertwined with their sales trend. In a fast-changing industry like premium personal care, our brand factor model helped to reveal that staying top of mind translates directly into financial success for our client, but a recovery was necessary.

Armed with this learning, the company shifted much of its planned awareness media budget into deeper partnerships with targeted influencers and tastemakers to stay top of mind and best in buzz. 

Behavioral segmentation improves brand marketing ROI

Marketing effectiveness case study

Behavioral segmentation improves brand marketing ROI

The challenge

How much does brand marketing really drive new customer growth?

A client in the internet security space was struggling to drive meaningful growthThe category saw increased competition with lower-cost products entering the market, claiming incumbent market share.

Despite increased marketing investment, our client’s revenue was flat. The New Customer segment was showing some growth, but other business metrics weren’t improving.  

The objective

Optimize brand efforts

The client wanted to understand if recent brand efforts were effective in acquiring new customers and how to optimize their investment for the purpose of additional growth and scale.

Part 1: Understand new customers

Find the drivers of growth in the new customer segment by exploring:

Part 2: Model brand responsiveness

Model brand efforts’ impact on sales using media mix modeling (MMM) in order to:

The solution

Advanced brand modeling based on behavioral segmentation

We uncovered that the “new customer” segment was actually two distinct segments combined into one: customers who were truly new acquisitions and those who had upgraded their product from a previous version. 

Combining these two segments camouflaged a shrinking pool of brand-new customers, as the upgrader group was the segment showing real growth.

Part 1: Create behavioral segments

We leveraged internal client data to enable more accurate and actionable audience segmentation:

(A) Behavioral Segmentation

Defined mutually exclusive, collectively exhaustive (MECE) behavioral segments using existing data

(B) Segment Deployment

Deployed new segmentation in the client’s marketing database for real-time audience targeting and conversion labeling

(C) Segment Reporting

Developed reporting on these segments over time to validate shifts in audience mix align with the client’s strategic goals

Part 2: Quantify new customer brand engagement

We used media mix modeling (MMM) and multi-touch attribution (MTA) to determine which channels drove purchases among the newly defined brand-new customer segment:

(A) Measured channel effectiveness

Built effectiveness models to determine the channels and platforms that had the greatest impact on brand-new customer acquisition, generating marginal response curves to aid in scenario planning.

(B) Calculated true marginal cost-per-acquisition

Econometric models revealed that brand investments were highly effective at generating new customer acquisition.

Unsurprisingly, these efforts did little to entice product switchers. Splitting out these segments pointed to significant budget readjustments.

Business impact

Brand campaigns targeting the right segments led to improved ROI and growth

With our insights and recommendations, the client was able to increase their marketing ROI and optimize their budget towards increasing both brand-new and existing customer conversion rates.

Improved targeting

Look-alike audiences under the former “new customer” segment yielded poor targeting and muddled segmentation.

Leveraging the “brand-new” customer segmentation resulted in better targeting and improved conversion rates, decreasing acquisition costs. 

Optimized brand investment

Brand awareness efforts attracted brand-new customers, while more mid-funnel activities and affiliates drove product switching among existing customers. This insight led to executive approval to move budget up-funnel to acquire more brand-new customers.

The client also moved existing customers into up-sell campaigns and suppressed them from new customer acquisition efforts to improve ROI across both initiatives.

Insurance provider exceeds growth projections by 61% with strategic market expansion​

Growth strategy case study

Insurance provider exceeds growth projections by 61% with strategic market expansion​

The challenge

What’s the secret to conquering an untapped market?

Sustainable revenue growth relies on successful market expansions, yet many enterprises struggle to answer key questions like ‘Who is the customer?’ and ‘How do we deliver value efficiently?’ In the health insurance market, strict regulations and regional monopolies make it even more challenging for smaller players. A leading national insurer sought to capitalize on the success of a rapidly growing product and expand into an untapped market. Despite strong growth and margins, they lacked insights into the space and its consumers, making it difficult to establish themselves as a top competitor.

The objective

Strategize market penetration to expand footprint

The insurance provider partnered with Marketbridge to assess the market landscape and plan their expansion. They aimed to grow their market share and increase their footprint by over 50%. First, they needed a clear understanding of their current and potential market, along with a better sense of product-market fit. Then, they focused on refining targeting, messaging, and consumer outreach to effectively engage the new audience.

The solution

A targeted strategy for customer expansion

Step 1: Market sizing

Marketbridge started with a comprehensive market sizing analysis, evaluating growth projections, segment opportunities, and the client’s planned expansion into new states. The findings revealed the potential for the client’s market footprint to double, with the possibility of acquiring over one million new customers in the coming years. With this significant growth opportunity, it was critical for the client to act decisively and efficiently to capture market share.

Step 2: Customer segmentation

We then conducted both qualitative and quantitative surveys of prospective customers to refine segmentation strategies. By analyzing key metrics like age, marital status, income, and medical history, we identified two primary customer segments. We then further sub-segmented these into five smaller groups, allowing for more targeted and prioritized outreach.

Step 3: Prospect identification

Leveraging public health data, we developed a targeting model using logistic regression to assess the likelihood that a profile in the client’s database represented a potential customer. This model allowed the client to efficiently target prospects with direct mail and other materials for new offerings, successfully identifying 70% of potential customers. We also trained the client on using this model, helping them better allocate resources and focus on high-probability leads, ultimately improving both marketing and sales efficiency.

Step 4: Go-to-market playbook design

With enhanced targeting and segmentation in place, we reviewed the client’s existing sales plays and identified opportunities to optimize agent and broker approaches. Tailored marketing tactics were developed for each stage of the customer acquisition journey, with a focus on educating prospective buyers. Sales and broker tools were also created to guide customers through the process, ensuring they had the right information to drive product purchases. We evaluated the potential impact and ease of implementation for each tactic, prioritizing high-impact actions and low-difficulty solutions for quick wins.

Business impact

Unprecedented market growth

Increased market share-of-voice

Agents were better equipped to guide prospective customers from discovery to purchase. Increased online information and support from primary care providers boosted brand awareness and positioned new offerings across the covered territory.

Improved campaign performance

The new playbook improved the buyer experience and campaign touchpoints. Direct mail and email were more effective, broker support and online resources increased demand, and flexible purchase options and post-purchase support fostered loyalty.

Exceeded growth projections by 61%

With segmentation, targeting systems, and a new sales playbook, the client exceeded acquisition goals. Existing markets saw over 100% growth from 2021 to 2022, and total customer base grew 61%, tripling by January 2022. By July 2022, growth continued with an additional 30%.

SaaS company boosts opportunity value by 40% with competitive compensation

Sales organization design case study

SaaS company boosts opportunity value by 40% with competitive compensation

The challenge

Is our sales strategy built to attract and retain top talent?

As they prepared for the 2022 fiscal year, a software company introduced a new sales coverage model for its top-tier accounts and newly acquired product. To enhance selling capabilities, they created both account management and enterprise selling roles. But leadership faced key concerns—were their sales strategy, territory design, and compensation plans competitive enough? Their existing model lacked pay-for-performance, making it harder to recruit and retain top talent in a competitive market. To drive fast growth and improve hiring appeal, they needed a refined compensation plan that aligned sales incentives with business objectives.

The objective

Driving sales performance through better compensation

By partnering with Marketbridge, the client recognized that a revised pay-for-performance plan could drive stronger sales beyond target metrics—especially for strategic products. An updated model would enable higher target attainment while making the company more competitive in recruiting top enterprise and strategic sales talent. Expanding these roles would not only enhance the customer experience but also increase sellers’ earning potential—all while keeping costs neutral.

The solution

Four-step approach to balancing sales incentives, cost, and performance

Step 1: Post-acquisition integration

Marketbridge helped integrate the client’s newly acquired product and existing product sales team into the global commercial organization to drive incremental growth while minimizing disruption to the legacy team. In addition, they validated their current go-to-market engagement model with the new enterprise and specialist selling roles.

Step 2: Compensation design

Given the current alignment of strategy and information obtained in the baseline assessment, Marketbridge designed new compensation plans for the newly created enterprise and strategic selling roles. The pay acceleration feature of these new plans not only incentivized the sales team to exceed their targets, but also increased incentives to focus on selling strategic products, accelerating growth in those areas, as well as improving overall quota attainment.

Step 3: Cost projections

To simulate the cost of the new compensation plan to the client, Marketbridge developed a model that utilized a log linear regression to model real world target attainment. By looking at total payout costs for the client in low, target, and high-performance scenarios, it was shown that new compensation plans would save the client money in low performing situations. Additionally, the updated plans had a very strong E/R ratio regardless of attainment level and showed very low incremental cost of employment.

Step 4: Implementation

To facilitate the effective implementation of new compensation designs, Marketbridge laid out an outline for the client detailing key requirements for a successful launch—such as systems integration, sales playbooks, and training on the new plans. Integration of new plans into compensation management and administration was also a key to success on the managerial level. Additionally, Marketbridge created enablement materials to drive improved performance and engagement of the sales team.

Business impact

Accelerated revenue growth and talent acquisition

By aligning incentives with performance, the client drove revenue growth, improved retention, and gained a competitive edge in hiring—all while keeping costs low.

Competitive hiring excellence

With the new pay-for-performance plan, the client attracted top enterprise sellers, tripled their specialist team, and earned a spot on Fortune’s 100 Best Companies to Work For.

Cost-neutral implementation

Despite higher payouts for top performers, the client lowered costs, with sales and marketing expenses under 20% of revenue in Q4 2022—driving both customer and revenue growth.

40% value growth

New incentives drove a 35% boost in bookings, a 40% jump in opportunity value, and 60% YoY growth in strategic products. The executive seller role also improved support and retention.


Designing competitive, customer-first positioning using direct research

Market research case study

Designing competitive, customer-first positioning using direct research

The challenge

How do you stay competitive in a rapidly changing market?

A large software provider planned to shift its entire product portfolio to an as-a-service model by the next year. With competitors already ahead, the company needed to refresh its positioning and messaging to better connect with buyers. Sales teams were unprepared to sell the new offerings, and there was uncertainty about how to present them effectively. The company had to move from a product-focused pitch to one that highlighted customer experience and value.

The objective

Strengthen internal alignment, elevate market impact

To implement a successful SaaS strategy, Sales and Marketing needed broad organizational support for the shift to as-a-service selling. This required clear, evidence-based messaging that explained the change internally and highlighted the superior value for buyers. By updating the positioning with compelling, customer-focused messaging, they could better showcase their unique advantages over competitors.

The solution

Research-backed messaging that differentiates

Step 1: Primary buyer research

First, we conducted primary research to collect insights on buyer priorities and challenges to streamline workflows, use cases, value propositions that resonate best, along with their gaps and unmet needs. Executed a quantitative survey and qualitative interviews with buyers (across three use cases) to collect insights.

Step 2: Messaging and positioning architecture development

Combined research findings with the company’s vision to create use case agnostic Messaging and Positioning Architecture (MPA) and use case specific / persona specific MPAs. With this, Marketbridge also conducted in-depth competitive research to understand how major and emerging competitors are positioning their XaaS solutions to industries and key personas.

Step 3: Persona development

Used research findings to iterate use case(s) for agnostic MPA and MPAs by role; Executive, Manager, and Individual Contributor for a total of 12 personas. In addition, current messaging and positioning across competitive provider properties were summarized to then spotlight variations in personas and messages.

Business impact

Clearer positioning, greater competitive edge

Identified biggest solution gaps and weaknesses

By gathering insights on buyers’ needs, the provider identified where their messaging needed improvement by use case and persona. This enabled them to compete with established rivals and protect against emerging competitors.

Triggered pivots to messaging

Supplied with comparative marketing messaging, umbrella messages, and supporting points, the marketing team could rapidly change language across their online and offline properties. In addition, they could now ensure a consistent voice for their brand

Informed strongest value drivers by use case & role

Armed both direct and channel partner sellers with succinct positioning statements, differentiators, and proof points. This all informed the optimal sales scripting needed during the evaluation phase of the buying journey.

Driving customer acquisition efficiency with marketing science

Marketing effectiveness case study

Driving customer acquisition efficiency with marketing science

The challenge

How can we leverage data to validate our marketing budget?

With costs of online and offline channels rising, a Fortune 50 healthcare payer was facing the challenge of justifying annual marketing expenditures.

The organization had previously invested in various marketing effectiveness measurement tools to aid in making investment decisions. However, these tools lacked integration and coherence.

This disjointed approach resulted in fragmented insights, which hindered leadership’s ability to grasp the marketing landscape and to allocate resources effectively. 

The objective

Aggregate data sources to measure and optimize marketing spend

The client engaged Marketbridge to help them with marketing channel allocation. The goal was to enable informed decision-making by harmonizing various data sources and marketing effectiveness tools to provide a comprehensive view of the impact of marketing investments on business performance. 

Objective 1: Understand Full-Funnel Marketing Influence

Determine which channels across the funnel are driving applications:

Objective 2: Build a System for Scenario Planning & Forecasting

Integrate marketing effectiveness measurement into the investment tools ecosystem to:

The solution

Advanced statistical modeling led to enhanced marketing strategy

Marketbridge employed rigorous, scientific methods to quantify the return on marketing investment for each channel. This knowledge helped the client improve its investment strategy through more informed budget allocation decisions. 

Part 1: Implement Comprehensive Marketing Effectiveness Insights

The team implemented a comprehensive marketing effectiveness system that offered actionable insights to guide strategic decision-making. The solutions included: 

(A) Modeling and Attribution

The transition from simplistic last-touch attribution methods to a more holistic MMM and MTA approach illuminated the full spectrum of marketing impacts, revealing long-term brand value and cross-channel synergies.

(B) Forecasting

A sophisticated deterministic model provided accurate forecasts that enabled the healthcare payer to anticipate weekly demand at the market-level and adjust marketing strategies.

Part 2: Optimize Marketing Channel Efficiency

Using insights generated from the models developed above, Marketbridge created a centralized view of marketing spend effectiveness, facilitating rapid reallocation of budgets to maximize impact and return on investment. Client benefits included: 

(A) Channel Optimization

Invest more in high-performing channels while reducing spend in underperforming areas, based on detailed ROI analysis.

(B) Increased Organizational Coordination

Ensure that marketing and sales efforts were not only aligned but also mutually reinforcing, maximizing overall business performance.

Business impact

Efficient marketing planning led to improvements across several KPI's

With more efficient resource allocation and data-driven decision-making, Marketbridge’s client successfully navigated industry headwinds and charted a successful path forward.

Improved Marketing Efficiency

With transparent insights and accurate forecasting, the healthcare payer’s leadership gained the confidence to make proactive and informed adjustments to marketing strategies, enhancing overall marketing efficiency.  

Optimized Resource Allocation

The implementation of a nuanced attribution model and better channel optimization led to a reduction in acquisition costs and an increase in marketing ROI.

Strategic budget reallocations allowed the company to capitalize on high-impact marketing opportunities, driving greater efficiency and effectiveness across all marketing and sales initiatives. 

Embedded support transforms marketing analytics team

Marketing effectiveness case study

Embedded support transforms marketing analytics team

The challenge

How can a fast-moving, budget constrained team power increased marketing ROI?

A consumer internet security client faced a trifecta of lofty goals. Boost upper-funnel brand marketing, launch a new flagship product, and focus acquisition on higher value customers.

The team, led by multiple first-year executives, looked to Marketbridge for embedded analytics support.

The objective

Empower a nascent team to measure marketing effectiveness

The client sought expertise from Marketbridge in realizing a wide-ranging, ambitious agenda: wrangling disparate data, understanding effectiveness, testing to propel future growth, and storytelling with clarity

Part 1: Establish metrics-driven marketing investment

Design a quantitative feedback loop for marketing activity by introducing: 

Part 2: Support new team with analytical know-how

Enable early wins for the marketing analytics team by onboarding team members to:

The solution

An agile extension of the client's team

Given the variety of strategic priorities, Marketbridge served to augment the team’s analytical capacity. Our support to the team evolved into a series of business-critical workstreams, encompassing everything from data engineering within client systems to preparing slides for Board of Directors meetings. 

Part 1: Develop a scalable marketing and customer data asset

We quickly resolved disparate data sources containing marketing spend, website activity, and sales.

The result was a single, scalable Longitudinal Human Record (LHR), which became the foundation for powerful new insights.

(A) Integrated records

Processed clickstream records, vendor reports, and financial records into unified structure by conducting cross-system joins where possible

(B) Accessible codebase

Shared LHR assets with analytical talent on the client side, alongside documentation for future development

(C) Insights reporting

Exemplified executive dashboard reporting and data work for ad hoc analyses from LHR

Part 2: Build media attribution models

Marketbridge built econometric models to accurately assess media investments, advancing understanding beyond Last Touch attribution. 

(A) Media Mix Model (MMM)

Econometrically modeled the impact of marketing stimuli on eventual sales after accounting for seasonality, promotion, and macroeconomic factors as controls, delivering cost-pers and channel response curves.

(B) Multi-Touch Attribution (MTA)

Identified customer pathways to purchase, estimating the impacts of unconfirmed touches (e.g. TV impressions) along the way. 

(C) Media planning

Triangulated outputs across models and test results to drive strategic planning

Part 3: Embed measurement and testing expertise

We supported development of a testing agenda to distill signals into clear insights of strategic importance. 

(A) Test design support

Assisted in matched market selection and budget power analysis for finalization of test design parameters, and conducted incrementality results analysis

(B) Dashboard of sales contributions

Consolidated MTA model results in a real-time dashboard for rapid insight delivery

(C) Storytelling for executives

Assisted writing of executive-facing media investment narrative ahead of Board of Directors meetings

Business impact

Attribution modeling and testing uncovered investment value of upper funnel channels in winning new customers

We enriched our client’s understanding of channel interactions and customer segments through a set of fresh analytical methods for evaluating marketing effectiveness, ultimately guiding our client in how to best invest their marketing spend in a new era of growth.

Budget adjustments

With positive results from deliberate tests of newly incorporated upper-funnel marketing initiatives, the client continued to re-balance their media mix away from duplicative demand-capture channels and towards brand-building and demand generation.

Attribution models reinforced this budget shift, and incrementality tests highlighted the waning effectiveness of price promotions and affiliate marketing tactics. 

Clarified view of acquisition

The newly developed customer data asset powered advancements in segmentation. This translated to a key insight: demand-capture marketing generated mostly low-value, high-churn acquisitions.

Operationalizing a new segmentation, the team was able to measure, test, and scale brand-building tactics against this cleaned segment, raising acquisition efficiency.

Measuring marketing’s impact across multiple sales channels

Marketing effectiveness case study

Measuring marketing's impact across multiple sales channels

The challenge

How many sales does marketing drive across all sales channels?

As COVID hit, a personal tech had client shifted tactics, opting focus on D2C sales, luring prospects with discounts. However, though sales were buoyed by the pandemic, the direct channel never surpassed the pre-pandemic size and scale of retail.

As Marketbridge began our engagement, the strategy shifted again. Now, the focus returned to retail, and the direct discount was removed. The marketing budget, previously focused on driving direct sales, was now under major scrutiny.

Our client needed to quantify marketing’s impact and optimize budget to drive sales across both sales channels.

The objective

Optimize marketing budget for online and offline sales channels

Our client needed to measure impact and fine-tune the budget to drive sales in both channels: retail and D2C. We identified three key objectives to bring this clarity.

1: Understand drivers of retail sales

Build a retail media mix model (MMM) to gain insight into how marketing channels drive retail sales.

2: Update D2C MMM for new reality

Refine an existing direct-to-consumer MMM to understand marketing performance after the strategic shift.

3: Find optimization opportunities

Reconcile findings from both MMMs to provide holistic optimization recommendations.

The solution

Multi-model approach to measure marketing impact

Leveraging our deep understanding of the D2C business, we launched discovery with retail stakeholders and quickly learned the drivers and mechanisms of retail channel performance.

Modeling across sales channels provided new insights into how to optimize marketing spend to maximize sales while considering gross margin differences.

Part 1: Build the retail model

We developed a media mix model (MMM) for retail leveraging weekly sell-through data. To ensure a thorough understanding of marketing’s impact, we developed robust competitor and price controls.

(A) Find channel incrementality

Generated insight into which media have positive impact on retail sales and which have a zero or negative impact

(B) Consider gross margin

Used gross margin to calculate the CAC to account for distribution cost through retail

(C) Identify potential tests

Provided insights and testing opportunities to optimize marketing budget to drive retail sales

Part 2: Develop holistic view of marketing’s impact on sales

After refining the direct-to-consumer MMM, we combined results across models to provide insights, recommendations and tradeoffs for investment optimizations.

(A) Estimate overall ROAS

Found opportunity for increased investment as blended CAC and ROAS were significantly below established thresholds

(B) Flag negative channels

Paid search negatively impact on retail sales, raising questions of channel level trade-offs and cannibalization

(C) Optimize for sales volume

Provided recommendations on investment optimizations to maximize sales across distribution channels

Business impact

Holistic understanding of sales impact resulted sales optimizations

After years of optimizing marketing budget based on known direct-to-consumer impact and hypothesized potential impact on retail, the client organization was pleased with a more holistic understanding of marketing’s impact.

Shifted goals for marketing team

The new blended MMM demonstrated that marketing investment would drive more sales if shifted up funnel. This resulted in a reduced direct channel sales goal and a significant boost to retail targets.

Optimized budget to drive additional 9% in sales

Client shifted budget from paid search, to brand-building, resulting in an additional 9% in overall sales on flat budget by avoiding cross-channel cannibalization.

Communicated value to retail partners

Quantifying marketing investment impact on retail sales energized retail partners while coordinating promotions and in-store advertising.

Skip to content