
Concept
A common problem with media mix models (MMMs) is over attribution of down-funnel, demand capture channels, such as paid search and affiliate. These channels have become, in some cases, distribution channels rather than marketing channels. Said another way, many actors have naturally sought to extract economic rent by inserting themselves in a buyer’s discovery and purchase process.
Importantly, there are two different kinds of down-funnel rent seekers: Duplicative and Distribution Taxing. They are defined by what would happen if they weren’t in place, in other words, the counterfactual case.
- If Duplicative channels were removed in the counterfactual case, nothing would happen to sales.
- If Distribution Tax channels were removed in the counterfactual case, sales attributed to these channels last touch would disappear.
Google search is perhaps the best example of distribution taxing. Given Google’s ubiquity, it is essentially impossible for the average consumer to get around the search interface, and in a competitive market, money must be paid via a search bid to be in the list of considered companies. Hence, removal of the bid term will likely result in lost sales. It is generally impossible to disintermediate well established distribution taxers, but it is important to understand where they sit and the amount of economic rent they demand, typically best understand as a percentage of revenue—just like the margin discount a manufacturer provides to a retailer.
| Accretive | The channel created new demand, or captured demand that would have gone unfulfilled | |
| Demand Capture | Distribution Tax | The demand was driven upstream (usually by mid-funnel tactics), but down-funnel “marketing” channels will drive it to someone else—unless you pay the toll |
| Duplicative | You would have gotten the sales somewhere else—usually somewhere cheaper |
Figure 1: Three basic types of down-funnel channel; two are truly “demand capture”
Certain Affiliates, on the other hand, are often duplicative. In the case of a toolbar like Honey, the Affiliate is essentially cherry picking, waiting until the consumer is ready to buy to take credit. In these cases, removal of the bid to these platforms will likely have little effect.
The third type of channel, accretive, generates demand that would otherwise not have happened. This is often taken into account in a taxonomy determining the channel’s objective funnel position—usually called demand generation—but any channel can be accretive. For example, a demand capture channel that nudges an on-the-fence buyer to purchase could be partially accretive.
A helpful way to think about the degree of duplication is downside elasticity. Using our counterfactual example, this is simply the quantity of sales lost divided by what we would have predicted the loss would be based on the channel’s assumed ROAS—usually reported on a last touch basis. For example, say that an affiliate channel reports a ROAS based on last touch of 5 (an investment of $1M drives $5M of sales, e.g.) In the counterfactual case of no investment in the channel, say we only lose $1M of sales. The downside elasticity would be 0.2—not a great result, implying that the true ROAS is about 20% of that reported.
Downside elasticity: The total revenue lost when deinvesting in a channel (all other things being equal) divided by predicted lost sales based on assumed (usually last touch) ROAS
| Channel | Assumed ROAS | Deinvestment Amount | Lost Sales | Assumed Lost Sales | Downside Elasticity |
| Branded Paid Search | 5 | $1M | $1M | $5M | 20% |
| Paid Social | 4 | $1M | $4M | $4M | 100% |
Figure 2: Downside elasticity is a helpful way to think about duplication vs. incrementality.
Measurement
In reality, all channels have some mix of duplication, distribution taxing, and accretive behavior. It is the job of the marketing analyst to estimate this ratio and keep it fresh. There are two basic ways to do this: econometrically and via testing.
In marketing, econometric estimation of cause and effect is called MMM (media mix modeling or mixed media modeling, depending on who you ask.) In this approach, stimuli (marketing promotions and earned media) are used to explain response (sales or some proxy). In the case of down-funnel channels, it is critical to model these as an intermediary between demand generation and sales. In other words, the modeler must create multi-stage models to allow a channel like search both “receive credit” from other channels, and “create demand.” This can be a challenge for the modeler, as multiple “second stage” channels are generally required. This ends up looking like a system of equations, and visuals are extremely helpful to remember what is going on.
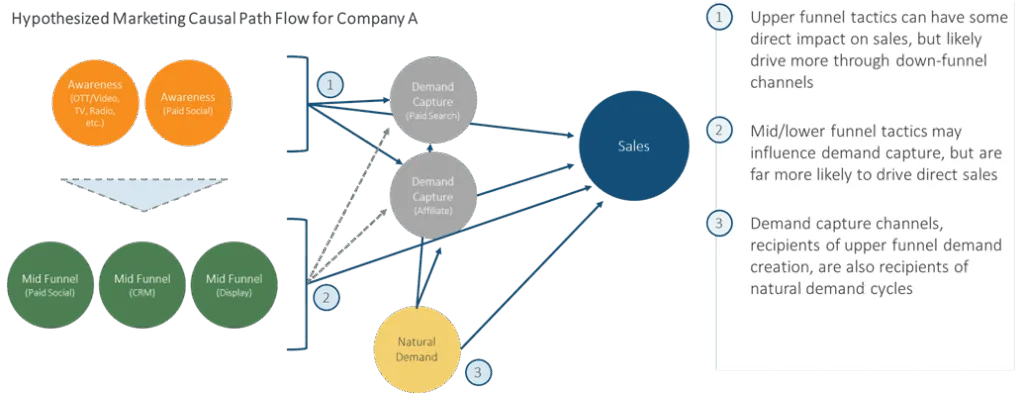
Figure 3: A system of equations is helpful to visualize what’s going on with channels in an MMM.
After the modeling is complete, it is possible to list each channel’s CPA (cost per acquisition) and / or ROAS (return on advertising spend, essentially the inverse) in three ways: last-touch (what Google or the Affiliate will take credit for); one-way (the causal impact of the channel not taking other contributing channels into account); and multi-stage (removing credit and reassigning it to contributing channels.) Seeing these three metrics side-by-side allows marketers to understand the trade-offs between channels, and to better interpret the often misleading results reported by platforms and agencies.
We sometimes call this a “systems expansion” view of marketing contribution. In the figure below, which for simplification’s sake does not include last touch data, each channel’s single-level regression spend, return, and ROAS are listed in the upper-left table. In the top-right table, each “upper funnel” channel’s contribution to paid search and affiliate are added to its last-touch contribution, and then subtracted for paid search and affiliate. Once ROAS are adjusted, an “MTA effect” (in the bottom left table) is calculated—essentially the degree to which each channel is taking credit from or giving credit to other channels.
“Single Level” MMM Return and ROAS:
| spend | return | roas | |
| dm | 65,102,400 | 60,860,154 | 0.93 |
| online_video | 5,349,912 | 40,573,436 | 7.58 |
| ooh | 7,892,882 | 58,606,074 | 7.43 |
| social | 17,629,144 | 60,860,154 | 3.45 |
| paid_search | 43,024,004 | 160,791,024 | 3.74 |
| affiliate | 12,402,081 | 113,455,349 | 9.15 |
| intercept | – | 256,213,734 | |
| total_receiver | 151,400,423 | 751,359,924 | 4.96 |
Multi-Level MMM Return and ROI:
| spend | paid_search | affiliate | total-driver | roas | ||
| dm | 65,102,400 | 22,671,534 | 3,630,571 | 87,162,259 | 1.34 | |
| online_video | 5,349,912 | 19,455,714 | 6,126,589 | 66,155,739 | 12.37 | |
| ooh | 7,892,882 | 5,145,313 | 8,849,517 | 72,600,904 | 9.20 | |
| social | 17,629,144 | 16,239,893 | 9,189,883 | 86,289,930 | 4.89 | |
| paid_search | 43,024,004 | 49,041,262 | 49,041,262 | 1.14 | ||
| affiliate | 12,402,081 | 36,872,988 | 36,872,988 | 2.97 | ||
| intercept | 353,236,841 | |||||
| total_receiver | 151,400,423 | 160,791,024 | 113,455,349 | 751,359,924 | 4.96 | |
“MTA Effect”:
| dm | 43% |
| online_video | 63% |
| ooh | 24% |
| social | 42% |
| paid_search | -70% |
| affiliate | -68% |
Figure 4: The MTA effect can be calculated by dividing a channel’s true “driver” contribution by its last touch or single-level MMM contribution. A positive effect means the channel is more accretive than it appears, and a negative effect means it is over-crediting on true incrementally.
Of course, testing is the gold standard way to calculate a channel’s incrementality or downside elasticity. There are generally two options: Geo-based holdouts or time-based reductions.
Geo-based holdouts using synthetic controls have become common in modern marketing. In this approach, several test markets are chosen for a treatment—either a positive (upside) treatment or a negative (downside) one. At the same time, a synthetic control—essentially a weighted grouping of the remaining markets—is set aside to run at “standard” levels. Then, a causal inference Bayesian analysis is performed to understand the difference between the experiment and the control-the counterfactual.
The challenge with geographic tests is that they can be difficult to execute. In many cases, it is simply impossible to persuade an affiliate to shut off bids geographically (for obvious reasons—they don’t want to be tested.) In other cases, algorithmic optimizations interfere with test purity. In these cases, a whole market reduction in spend can be used. In this case, a channel can be “dimmed” by, say, 50% to understand reduction in sales. This is not as statistically easy to read—there is no same-time-period counterfactual—but they provide the natural variability that can be read in an econometric time series (MMM) model.
Key Takeaways
- It is important to think about demand capture channels as distribution taxing, purely duplicative, and accretive
- Distribution taxing channels cannot be avoided, but should be understood strategically to potentially disintermediate with long-run go-to-market strategy changes / routes-to-market
- Analysts can be model duplicative and distribution-taxing channels via a multi-stage econometric modeling approach inside of an MMM
- Last-touch, single-level, and multi-level CPA and ROAS should be reported side-by-side in output
- The gold standard to understand downside elasticity is a geo-based holdout