A brand new approach to marketing mix insights
Today’s marketing leaders are looking for instant, accurate, and complete insights from their analytics stack. Unfortunately, no single tool–whether Testing, MMM, or MTA–can be that golden bullet on its own. The solution is to combine all three approaches into one unified system. We call this ITMA, or Integrated Testing-Mix-Attribution, but increasingly this approach is called Unified Marketing Measurement.
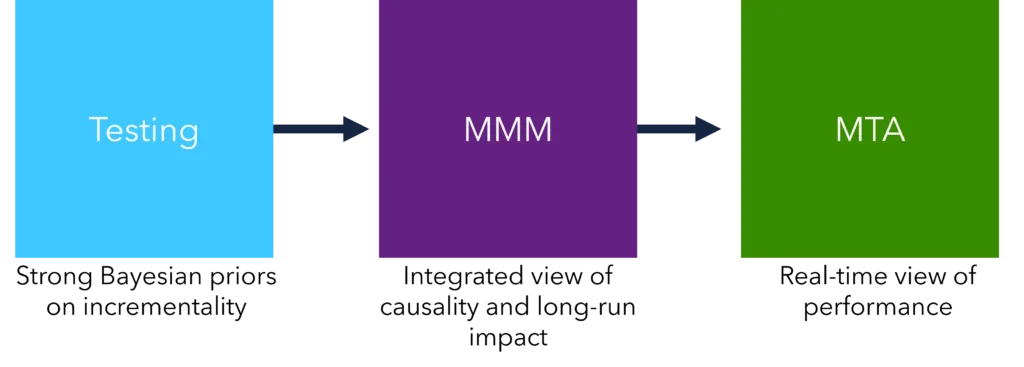
In ITMA, we use each inferential method for what it is good for, in a partially automated, integrated data science environment:
- (T)esting is good for precisely understanding incrementality
- M(M)M is good for understanding long-run, non-marketing, and inter-channel effects
- MT(A) is good for fast reads with unlimited granularity

This approach provides significant benefits to the marketing leader:
- Immediate Results: Because results are built at a record level for each new sale, marketing leaders can understand channel, campaign, and audience attribution in real time via business intelligence dashboards.
- Consistent Answers: Because stimulus, response, control, and audience data all sit in one data lake, consistency is baked in.
- Confidence Estimates: Mean estimates are always shipped with upper and lower bounds, at any percentile. There is no limit to channel granularity; more channels mean confidence will decline but will re-narrow with time or testing.
- Total View of Causality: Integration of upper-funnel brand-focused marketing—and its impact on attitudes—is built in. Every channel comes with its immediate (within 90 days) and long-term impact, forming a complete picture of return.
- Marketing Data Lake: ITMA is built on a Spark delta lake (e.g. DataBricks) data lake that can serve multiple use cases, including reporting, ad hoc analytics, and activation. Because all of the data are pristine, marketers can most likely replace multiple existing systems with one unified ledger—a marketing income statement for the CMO.
The nitty gritty: how does it work
Marketbridge’s ITMA, or UMM, is built in Databricks, hosted at the cloud provider of your choice. This is not SaaS. Rather, it is a purpose-built, evolving service infrastructure that can be insourced as required.
Components include:
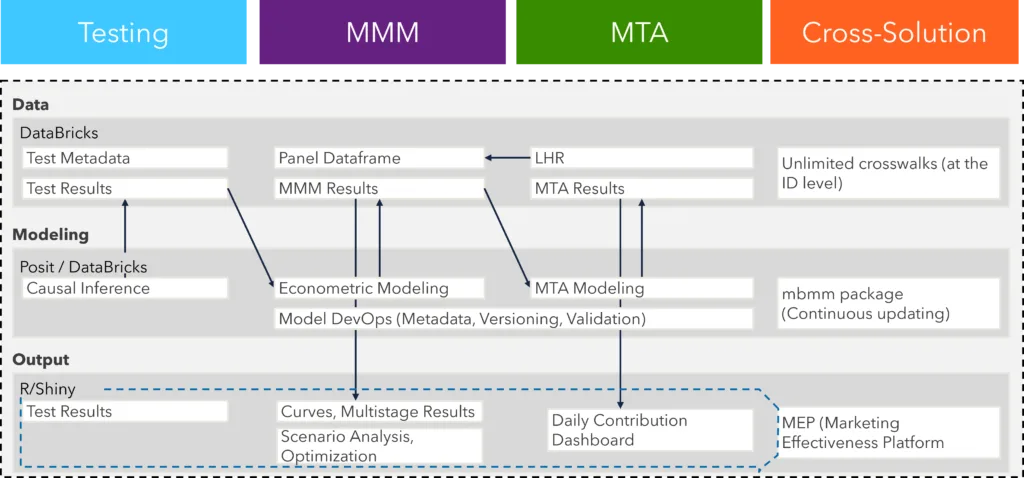
- Databricks tables with common taxonomy and metadata
- Data connectors to publishers, platforms, and marketing technologies
- Reproducible data engineering workbooks
- Version control and documentation in Github
- The R-Shiny front-end
MEP, which provides reporting, scenario analysis, and optimization - The R modeling library
mbmmm, which provide econometric, longitudinal, and testing inference, optimization, and taxonomy standardization

Marketing Data Lake
The ITMA rests on a marketing data lake: A complete view of marketing stimulus and response, along with associated audience and customer information. This data lake provides significant ancillary benefits beyond attribution and optimization; because it must undergo ongoing quality assurance (QA) testing and remediation, it can function as a marketing general ledger—a sorely missing component of many organizations.

Transforming go-to-market with composable CDPs, a scalable cloud architecture
The single source of truth for the enterprise’s go-to-market activities
The basic table structure starts with a longitudinal human record (LHR): a record of each individual’s interactions both “in the wild” (third party) and on domain (first party). Where identity resolution is not available, a probability is attached to a record to provide a complete view of potential stimulus. This LHR is then enriched with aggregated data (for example, upper funnel advertising, brand tracking, or economic data). When customers convert, first party demographic data can be cross-walked, and third-party demographics can be appended via an identity resolution service of the client’s choosing (for example, Experian, Equifax, or LiveRamp).
Because Databricks uses distributed storage and compute, query times are shortened from hours to seconds. When compute is not being used, clusters can be shut off, keeping costs reasonable.
Rapid Data Connectors
Because speed to insights is a primary objective of ITMA, shortening the time between marketing execution and ingestion into the data lake is critical. To accomplish this, APIs and direct linkages to data providers via cloud providers are the preferred methods of data transfer. This is most feasible for programmatic and digital marketing.
Reproducible Data Engineering
Marketing effectiveness measurement most often fails in the data transformation phase, before any analysis takes place. The “garbage in, garbage out” mantra is operative—small errors in grouping, summing, counting, and joining multiply and drive large errors downstream.
No black-box code or spreadsheet math is used to drive results. All code—whether custom for a given installation, Marketbridge libraries, or open-source libraries and packages—is available to inspect. Changes to code are preserved in perpetuity, ensuring auditability.

Download our whitepaper, “A roadmap for modern marketing analytics”
Download our whitepaper to learn more about reproducible data engineering in the context of marketing analytics.
MEP Front End
The Marketbridge Marketing Effectiveness Platform (MEP) is a web-based decision support interface that allows marketers to understand channel-by-channel return, run hypothetical scenarios, and optimize their marketing mix for different objectives. It runs on the same open-code framework, using the same data, all the way back to the longitudinal human record.
mbmmm
mbmmm comprises a set of libraries and packages that power statistical inference, model validation, metadata, and data structures. It is totally flexible and extensible, with no tight couplings that will limit future flexibility.
Case Study
A health insurance carrier was juggling multiple marketing measurement and effectiveness methods, tools, and data structures. Each provided different answers—sometimes dramatically different from system to system. This resulted in low trust in analytics and slow, unconfident marketing decision-making.
Marketbridge worked with the marketing analytics team to replace a black box MMM; a software-based MTA, and a fragmented testing approach with a single measurement and optimization process: ITMA. Over the course of nine months, technology, analytics, and change management workstreams were launched and ultimately integrated to provide marketing executives with a unified multi-channel performance system.
The core of the system was the Marketing Data Lake, built around each newly acquired customer. A complete graph of known and inferred touches prior to conversion allowed attribution, while crosswalks to first- and third-party data allowed almost unlimited audience profiling—critical in understanding how different kinds of customers made the journey from awareness to learning to shopping to submitting applications.
The data lake is fed into three core systems. First, an econometric model forecasting total applications and sales by day and by region was built. This model used the data lake as its main input, grouping and summing both stimulus and response to create a cross-sectional time-series data asset, updated daily. This econometric model—essentially an MMM (media mix model)—also estimated revenue, leads, and other KPIs, and included non-marketing variables like plan strength, the macroeconomy, seasonality, and pricing. Second, a testing “factory” was built and kicked off. Tests were planned in a systematic way, using a kanban board. Each test was appropriately scoped (with one learning objective); statistically powered for low-risk readouts; and scheduled and integrated with marketing execution teams.
Testing was championed at the highest level of leadership (CMO and Chief Commercial Officer) as an ongoing innovation driver; because of this, most short-run concerns about lost performance were overcome. Once tests concluded, standard readout templates allowed learning to be effectively catalogued and put into action. Finally, test results were fed back into the econometric model and the MTA as Bayesian priors.

Download our whitepaper, “Accelerate growth through test-and-learn marketing culture”
To learn more about the Marketbridge approach to test-and-learn marketing, download our whitepaper.
Finally, a multi-touch attribution (MTA) system used Markov Chain modeling to estimate how each upstream touch or interaction—whether known or inferred—contributed to the ultimate outcome. Priors from the econometric model (MMM) and testing were also fed back into the multi-touch model to provide better estimates for long-run and latent effects. This system powered a daily dashboard showing attribution for each channel, down to a “micro-channel” level (e.g., branded paid search, specific affiliate partners, Meta-social-reel, etc.) This dashboard was used by executives to tune campaigns quickly. As priors from MMM and testing were updated, inferences were likewise updated.
The system replaced a six-figure black-box MMM solution and several complex identity graph-based attribution technologies, saving around $2.5 million dollars per year, while adding near-real-time attribution, and reducing confusion from conflicting ROAS and CPA estimates. The marketing data lake quickly drove additional use cases, including audience profiling, customer experience, and media auditing. Within one year, overall marketing-touched applications increased at a higher than fair share rate, and early indications are that reinvestments in upper-funnel brand marketing is paying off in higher yield rates in previously weak markets.
What to expect
Embedded: We embed our world class marketing data science team inside your domain to build your system. No clean rooms, software licenses, or restrictive contracts. Because we act as our clients’ direct agents, there are no pass-through markups or side arrangements with other vendors or software providers.
Nine Months to Answers: The Marketbridge team sets up the ITMA system inside your domain in six months, and then spends three months in pilot mode, making sure everything works. Because we are consultants at heart, you get weekly updates from the start, where we work with your team to hook up data sources, instantiate tables, run models, and set up dashboards.
Don’t Lose Your Marketing Brain: Because the infrastructure we build is open source, you don’t run the risk of losing what’s been built. While the mbmmm and MEP packages are Marketbridge IP, your team can keep using them and extending upon them, whether we remain your provider or not, subject to a license that they stay inside your walls. This de-risks marketing measurement, future-proofing your team from unforeseen future technologies, marketing approaches,
We Stick Around to Keep the Innovation Going: Once ITMA is moved into production mode, the team shifts into “run” mode, providing weekly updates on marketing performance, making enhancements, and helping you move from good marketing performance to world-class.
New innovations are tackled using an agile approach. A backlog of tests, analytics features, and new data sources is maintained in a kanban board. We work with the client collaboratively to prioritize what to work on next. All new work is done using the same reproducible, white-box methods.
Learn more and get started
We would love to meet with you to understand the current state of marketing measurement and optimization at your company, and to plan an ITMA journey that will get you to better effectiveness in less than a year.
Complete the form below to schedule a meeting with our Chief Analytics Officer.
1 These more comprehensive econometric models are sometimes called “Commercial Mix Models” due to their larger scope. As the scope of explanatory statistical models increases, they become useful to other parts of the organization, like finance and sales.


