MEP Version 0.8.5
Over the past two years, we have been working on building a business intelligence, scenario planning, and optimization SaaS platform for marketers. MEP provides decision-makers with a single place to understand multi-channel performance, and perform “what-if” analysis of spend by channel.
A tremendous amount of care has been put into building MEP to be more than just a shiny app (no pun intended.) Each company (or business unit) has its own unique marketing mix and architecture, and each element of that architecture—channels, time granularity, cross-section (segmentation), upper- versus lower-funnel—has been parameterized in model objects. Model objects must validate using a JSON metadata file before they are displayed in the platform—and this provides real scalability.
For the first two years of its development, we were focused on critical infrastructure. We made steady progress below the water line, but there wasn’t a ton to show for it. Over that time, the team focused on integrating the front end with our big data back end (Databricks); user roles and permissions, to ensure that each user and client’s data were secure and private; building out our JSON metadata parameterization; adding support for all of the models and curve functions we use (Bayesian, GAM, etc.); and building out the critical tables and charts to understand marketing effectiveness.
Over the past three months, the ship has started to take shape over the water line, and it’s really impressive (it’s even more impressive knowing how robust the hull is—OK, I’ll stop torturing that analogy.)
Scenario Planning
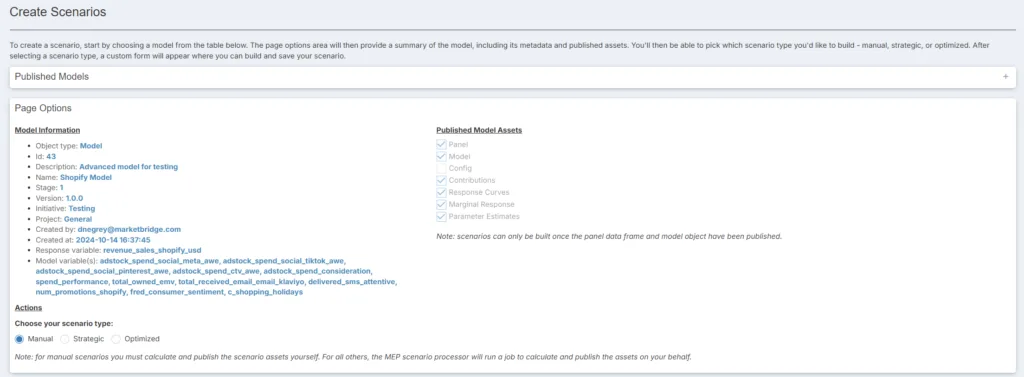
We thought a lot about how to let managers visually plan different levels of marketing spend, and show what the results of these decisions would be. At first, we deployed a simple spreadsheet download/upload function. We thought this would be the most flexible option, but our users thought it was clunky (it was). So, we went back to the drawing board and came up with three different on-platform scenario planning options: Manual, Strategic, and Optimized.

Manual provides the user with ultimate power. In this approach, users interact directly with model dataframes in Databricks and then recalculate the scenario. This is particularly useful for our analysts, who are routinely running scenario after scenario with tiny changes in spend and mix in preparation for client deliverables.
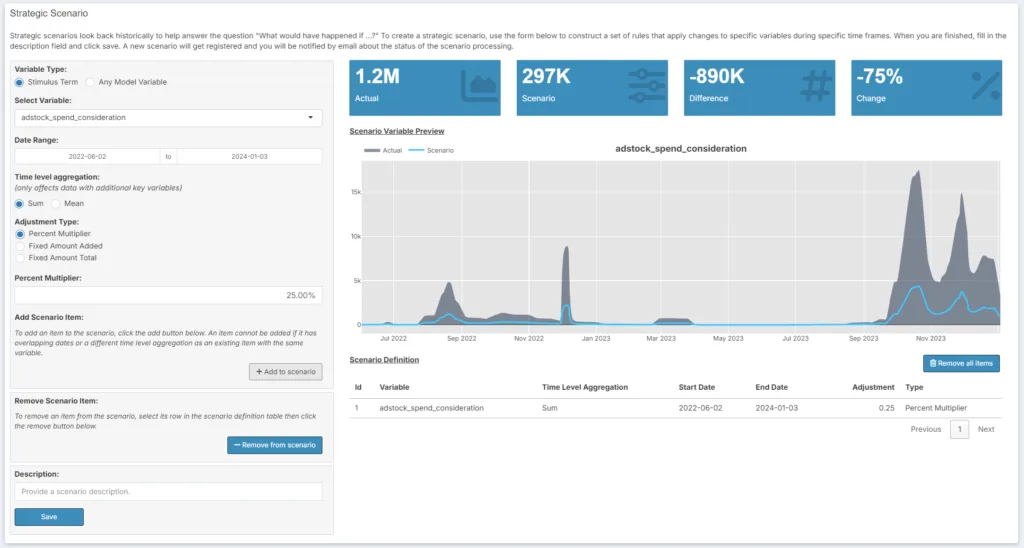
Strategic is for business users who want to quickly get to “what if” answers. In the strategic pane, users can choose any input variable—spend, impressions, or controls—and change it, up or down, either by a percentage of a fixed amount, for any time period. The number of these changes have no upper limit, and if you make a mistake, you can delete it. Once you’re happy with a scenario, you save it, give it a name, and then send it back to the Databricks cluster to run.

Optimized is just what it sounds like: A user can optimize for, say, total sales in a given period, and then add a series of constraints. Once they are satisfied, the scenario is sent back to Databricks for computation. This can take a while; these models aren’t simple linear regressions, so we can’t use matrix algebra to solve for an optimum. Instead, our awesome team (led by Sam Arrington) built a two-stage program that searches for a macro solution, and then hones in on a local minimum/maximum. When the optimization is done, the user gets an email and can see what the answer is.
When doing this work, we realized that the days of simple “linear program” (think Excel Solver) optimization for marketing are over. We’ve entered a new phase, where advanced machine learning techniques are required, not optional. I don’t like using “AI” flippantly, but we have some of that in here, and it’s the only way this works as fast as it does. More to come on that in coming quarters.
Model Comparison
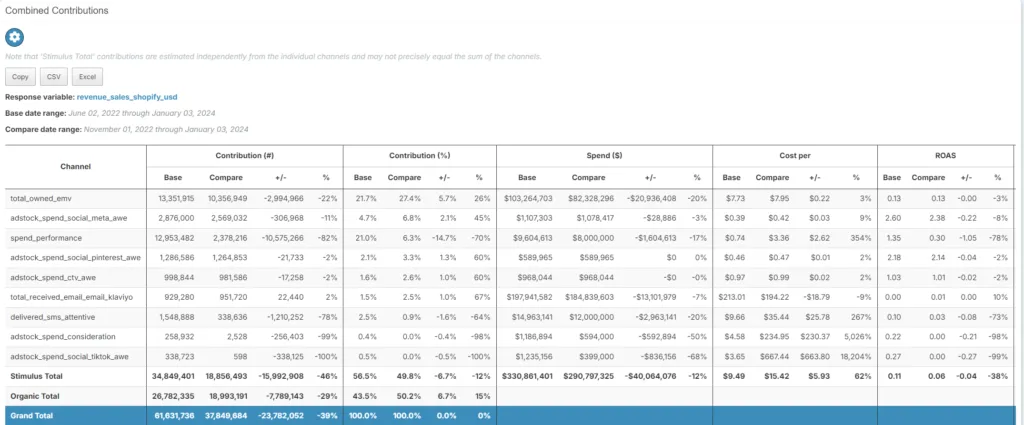
When we started down the path of scenario creation, we knew we needed an easy way to compare two models or outcomes. We went a little further than just allowing a user to compare two scenarios, however. We built a more robust method that allows a user to compare two of anything. The comparison looks both at overlapping channels and those that are only present in one of the objects—a full outer join, if you will. This allows a lot of flexibility—if you want to know how two different models look, you can do that, too. It’s basically a Swiss Army Knife for marketing data comparison, and will support many future use cases for MTA, testing, and basic reporting.

Multi-Stage Modeling
We spend a lot of time at Marketbridge making sure that upper-funnel tactics—like display, OOH, digital video, and social—get proper credit for their contributions to sales. To do this, we build multi-stage models, where upper-funnel tactics regress both on end sales and on so-called capture channels—typically branded paid search and affiliate.
To make this happen, models must be “aware” of other models—concretely, a dependent variable of one model is also an input (independent variable) of another model. Behind the scenes, this means that model objects have been built with metadata that attaches them to one another via variables.
At the same time, users should be able to visualize and link models together. In MEP, a user should be able to point a model’s output to another model’s input—potentially in an endless chain. We’ve added a neat visualization to make this happen.

Up Next: AI, APIs, MTA and Testing Integration, and Benchmarking
Our roadmap is really exciting for the rest of 2024 and into 2025. We’re working on a more integrated marketing measurement approach called ITMA (integrated testing, mix, and attribution) that takes the best elements of test-and-learn processes, econometric inference, and multi-touch attribution and integrates them into a single approach.
We are spending a lot of time building data connectors to the big publishers and platforms to get data into longitudinal human records (LHRs) and econometric data frames. Traditionally, the time to get data into a model has been the limiting factor for multi-channel attribution; our goal is to get this time down from months to hours. It’s a big job, with a lot of edge cases, but expect announcements on this in Q1.
AI is a big topic in effectiveness and attribution. Today, we use generative AI mainly in the code-building and model-construction phase. We have cut the time to write a function or method by around 80% using various AI copilots. The next big step will be integrating AI as “agentic search agents” looking for optimal fits and unexpected relationships.
Finally, benchmarking is a big ask from clients. What’s the typical CPA of branded paid search in healthcare? Is a ROAS of 120 good for a direct-to-consumer electronics company? What percentage of business should marketing be driving? Today, these answers are qualitative; we’ve done a lot of projects and “know” the answers, but we don’t have a quantitative database. The key to getting to this database is metadata and taxonomy. As I mentioned above, we’ve put a huge amount of effort into parameterization, so we will be starting a benchmarking service later in 2025 leveraging all of these data, at a channel and industry level.
That’s all for now on MEP. We’d love to talk to you about your marketing measurement and effectiveness challenges. Complete the form below to schedule a meeting!


