In the ever-evolving landscape of marketing attribution, businesses are engaged in an arm race to better measure and maximize ROI and growth. Beyond simple last-touch attribution, the two prominent methodologies often compared are Media Mix Modeling (MMM) and Multi-Touch Attribution (MTA). This article delves into the nuances of MMM vs MTA, exploring their differences, advantages, and how they can be effectively utilized to drive marketing success. The good news is that this isn’t necessarily an either / or decision; MTA can be used upstream and in concert with MMM to combine quick-read and long-run views of marketing’s effectiveness.
Before diving into MMM vs MTA, it’s important to note that the bread and butter of marketing reporting—last touch attribution—is still a powerful and simple tool, and should not be cast aside in favor of more advanced techniques. Last touch attribution credits the final interaction before conversion, generally using a direct database linkage via some kind of unique ID—a telephone number, URL string, or webpage tag. Last touch attribution will always be simpler and faster than multi-channel techniques. MMM and MTA outputs should always be looked at side-by-side with last touch reporting. It is often these comparisons that yield the most interesting insights.
Understanding Media Mix Modeling (MMM)
Media Mix Modeling (MMM) is a statistical technique used to estimate the impact of various marketing channels on sales performance. It aggregates historical data in a time series, usually across a geographic or other cross-sectional key, to measure the effectiveness of marketing efforts and to allocate budgets more efficiently. MMM can interpret any kind of stimulus, whether paid or earned, upper- or lower-funnel, or offline vs. online. It can also be used to understand the impacts of non-promotional factors—including price changes, competitive actions, product launches, and distribution channel strategy.

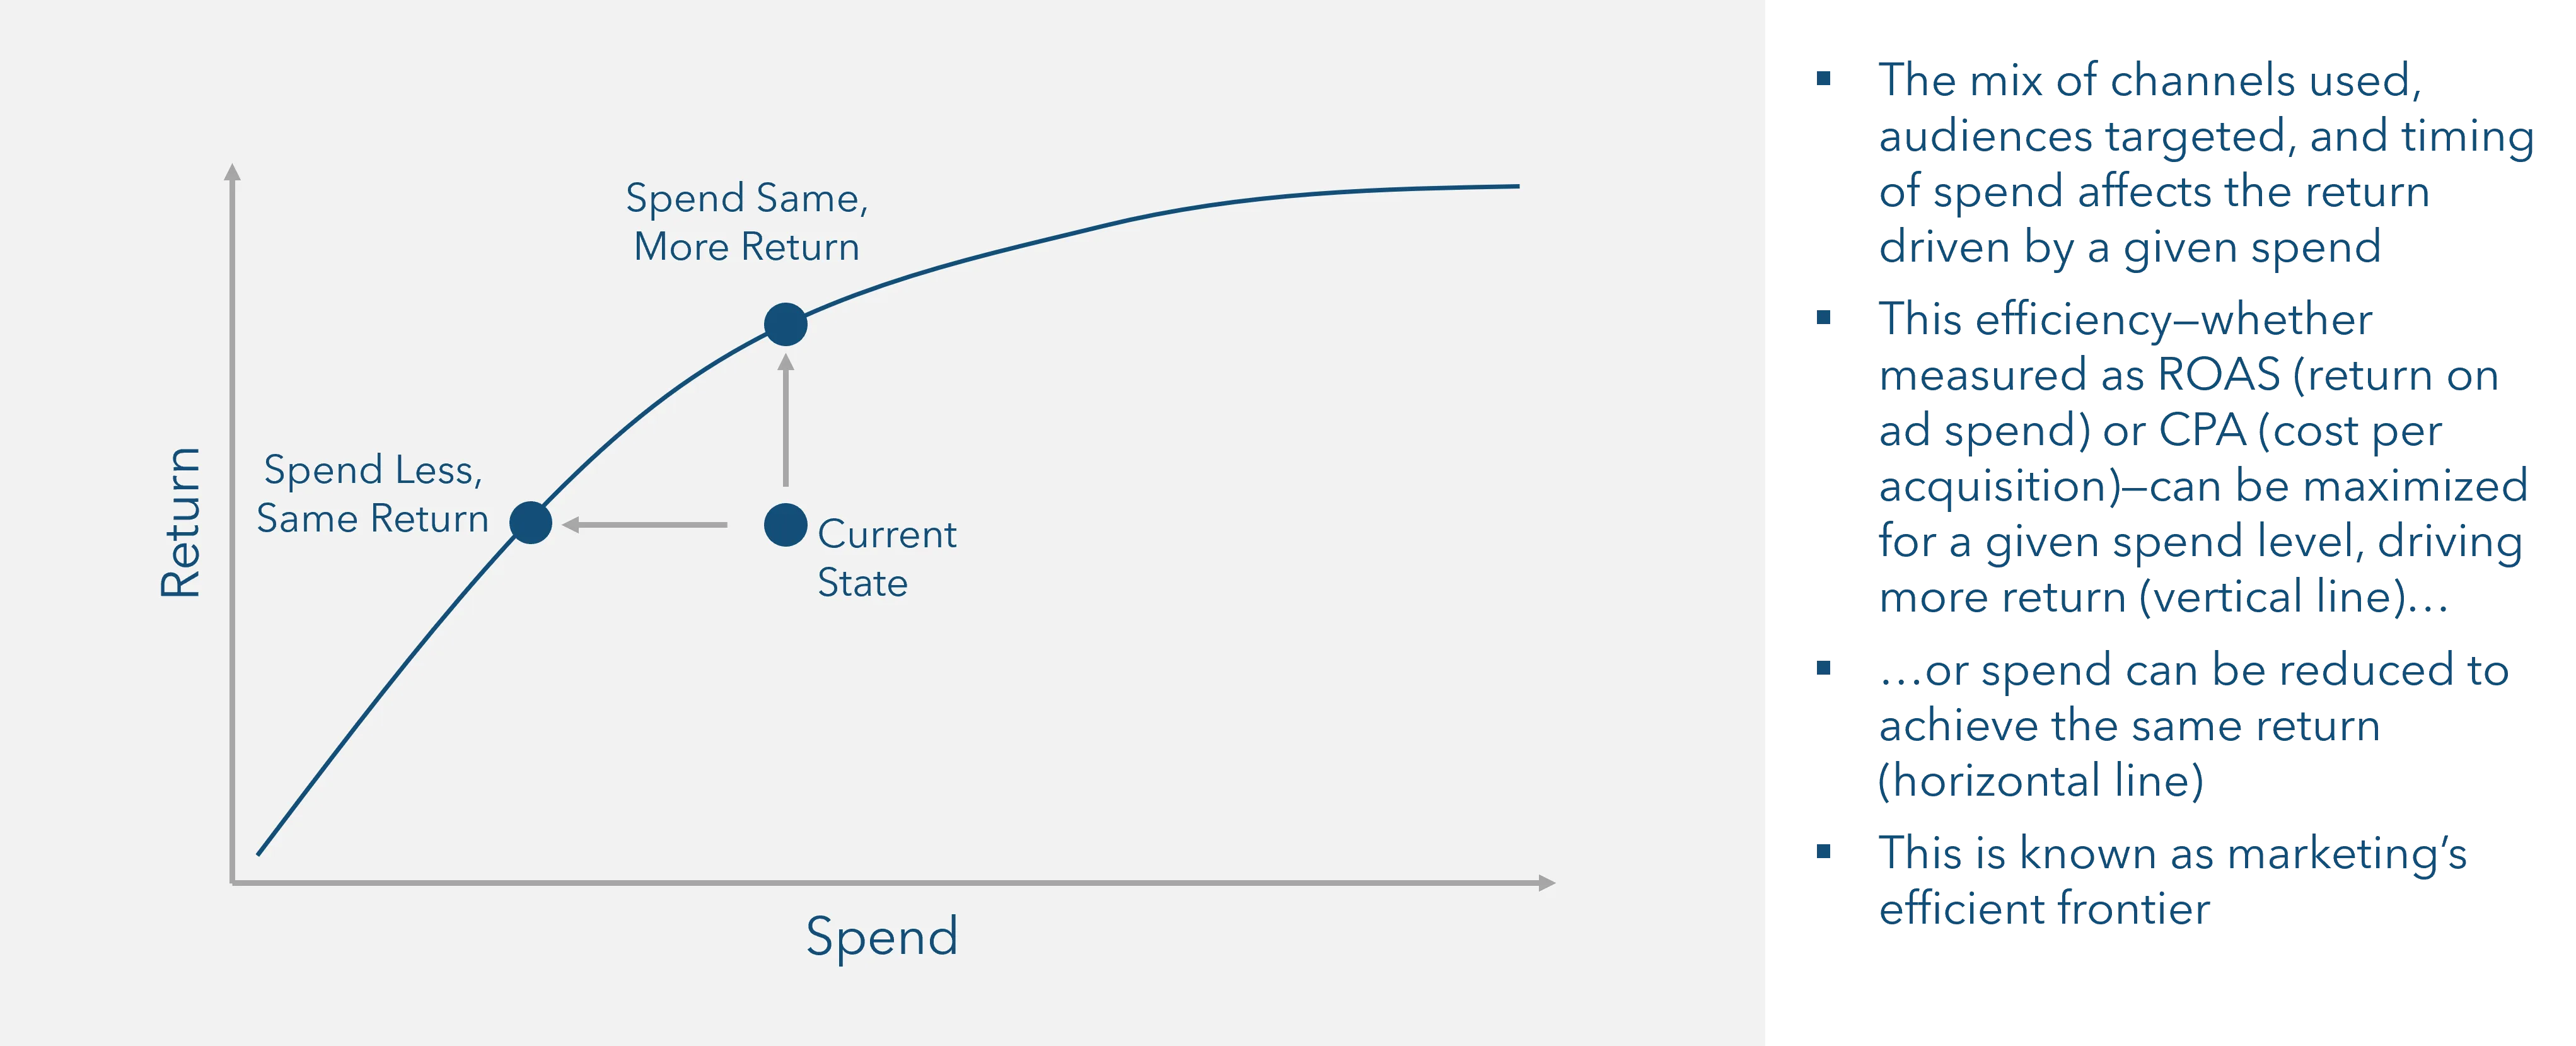
Figure 1: The basic idea behind MMM; there is an efficient frontier for marketing achieved by optimally mixing channels. This mix is different at different spend levels, but generally the macro curve exhibits diminishing returns to scale (its slope decreases as a company spends more).
Key Benefits of MMM
- Comprehensive View: MMMs provide a broad and complete overview of how different marketing channels interact and contribute to overall sales. This comprehensiveness is beneficial to understanding the combined effects of multiple marketing efforts and avoids over-crediting.
- Long-Term Abilities: One of the strengths of MMM is its ability to account for the longer-term impacts of marketing—whether over weeks and months, or years, in the case of marketing’s impact on brand equity. This is particularly helpful when trying to gain an honest accounting of the effectiveness of upper-funnel channels like TV and print, where effects are usually not immediate. This long-term focus also makes MMM less capable of reading “what just happened”—although techniques like rolling analysis windows can help with trending.
- Requires “Smaller” Data: MMM data frames are only a few megabytes, usually a few thousand rows and a few hundred columns. This generally makes it possible to store the data on a traditional device—a hard drive or simple cloud-based storage. MMMs can utilize either spend or impressions as its “x” or independent variables, and can use either sales or revenue as an ultimate dependent variable. Even so, MMMs need extensive historical data, usually a minimum of two years, making them more suitable for established brands with significant data accumulation. Brands without much historical data can still be boot-strapped with Bayesian priors.
Understanding Multi-Touch Attribution (MTA)
Multi-Touch Attribution (MTA) is a more granular approach that focuses on assignable channels—usually digital, but also including direct mail and interactions with known customers. It attributes conversions to the multiple touchpoints that a consumer interacts with throughout their journey. This method provides insights into the effectiveness of each touchpoint in the conversion path.
MTA was very popular in the early days of digital marketing, before privacy concerns and platform data hoarding made it harder to resolve identities across channels. In recent years, it has come under fire as first generation deterministic ID resolution approaches failed, but advances in data clean rooms and probabilistic exposure inference are making “second generation” MTA models a very attractive option for inference.
Key Benefits of MTA
- Close to Real-Time Insights: MTA models are capable of using real-time data, allowing marketers to make quick adjustments to their strategies. This is particularly advantageous in fast-paced digital environments. The devil is in the details, however—real-time results are only possible with very robust data pipelines and fast compute environments.
- Potentially Unlimited Granularity: Because MTA models are built at the log level, there is potential unlimited detail available about each individual touchpoint, helping marketers understand the specific role each interaction plays in driving conversions. Keep in mind that this detail is dependent upon robust lookup tables and cross-walks, as well as thought through marketing taxonomies.
- Consumer Journey Mapping: A side benefit of building the human longitudinal record required for MTA analysis is a 360-degree view of the journey. Exploratory data analysis (EDA) of this data artifact using big data tools can identify influential touchpoints, find breakdowns in e-commerce pipelines, and discover high-value audience segments. Even so, MTA data frames store much more data, at the record level. Log files, sometimes billions or tens of billions of rows, must be processed, demanding a big data compute environment.
Combining MMM vs MTA for a Holistic Approach
MMM vs MTA is how these methodologies are often perceived, but they can and should be used together. Integrating the macro-level insights from MMM with the micro-level details from MTA can provide a comprehensive understanding of marketing effectiveness. This integrated approach allows businesses to leverage the strengths of both models.
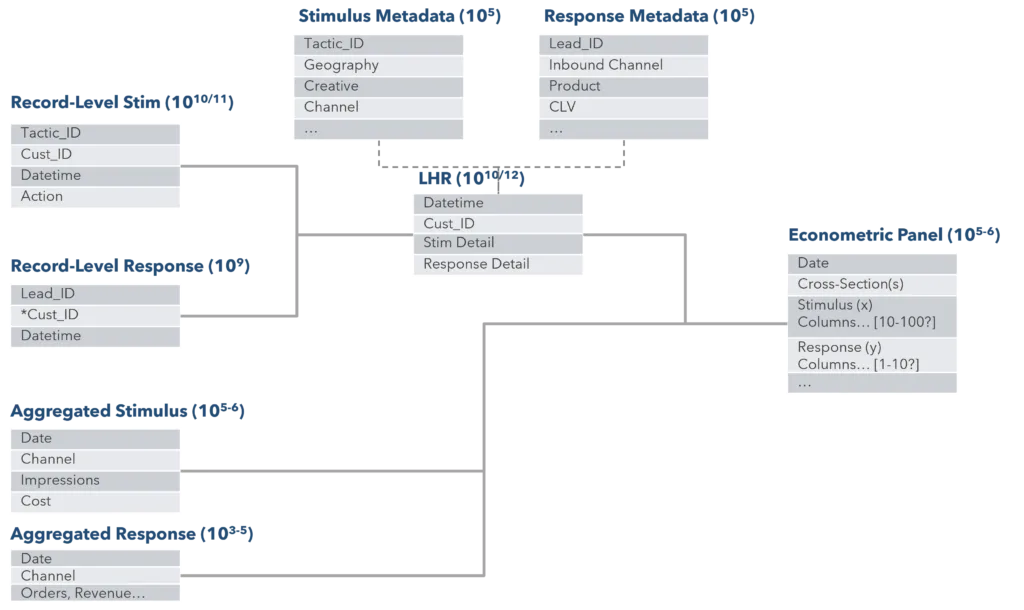
The record-level data required for MTA analysis can be used upstream of the MMM econometric panel structure, directly feeding it. In this way, the same “single source of truth” can be used for both analyses. Data that is not used in MTA—for example, survey data—can be joined after the raw data has been grouped and aggregated. Our recent white paper on the Go-to-Market Data Lake architecture details this approach. There are three main steps:
- Creation of Longitudinal Human Record (LHR): Tying customers’ journeys together in longitudinal chains can help locate points of friction, profiles audiences, and conduct multi-touch attribution (MTA).
- Creation of Econometric Panel: The LHR then serves as the base query to create an econometric panel for MMM. This panel is a summation of stimulus (x-variables) and response (y-variables) by day or week, across one or more cross-sectional dimensions.
- Data Aggregation and Supplementation: The panel is then supplemented with aggregated data, such as linear television or unresolved digital marketing data, to fill in gaps and ensure a complete dataset.

Figure 2: Start with record-level data to build the LHR, and feed the ultimate econometric panel to enable MMM.
Use Cases for MMM and MTA
It is best to think about the usage of MMM and MTA in the context of planning cycles. It is helpful to think of three marketing planning cycle types: strategic; tactical; and reactive.
Strategic Planning
Strategic planning typically happens annually, with more ambitious strategy resets looking out three or even five years. This type of planning typically looks at the total marketing investment envelope (e.g., $50M or $75M per year); the rough mix by funnel position; and any new channels or types of marketing to be tested at scale. MMM—particularly more advanced modeling taking advertising’s impact on brand equity—is the right tool for this exercise.
MMMs can be extended from measurement to optimization by extrapolating the curves outputted from statistical inference into “what if” scenarios, and then using machine learning to re-mix marketing until an optimal solution is reached. This optimization step can be a helpful input into the strategic planning process. It is important to note, however, that optimizations based on past results are not accurate when predicting huge budget swings. A good rule of thumb is that beyond a 20% increase or decrease in budget, curves become unreliable.
Tactical Planning
Tactical planning typically happens quarterly or annually, and looks at the specific channel and audience mix that will drive maximum ROI—sometimes called ROAS in marketing circles (return on advertising spend). Both MMM and MTA can be useful in the tactical planning phase. MMM is good to understand marginal customer acquisition cost (CAC), allowing campaign planners to re-mix channels to maximize effectiveness given a certain budget. MTA can then be mixed in to identify recent changes in channel effectiveness, and to get to granular detail on specific creative types, landing pages, offers, and cadence.
Reactive Adjustment
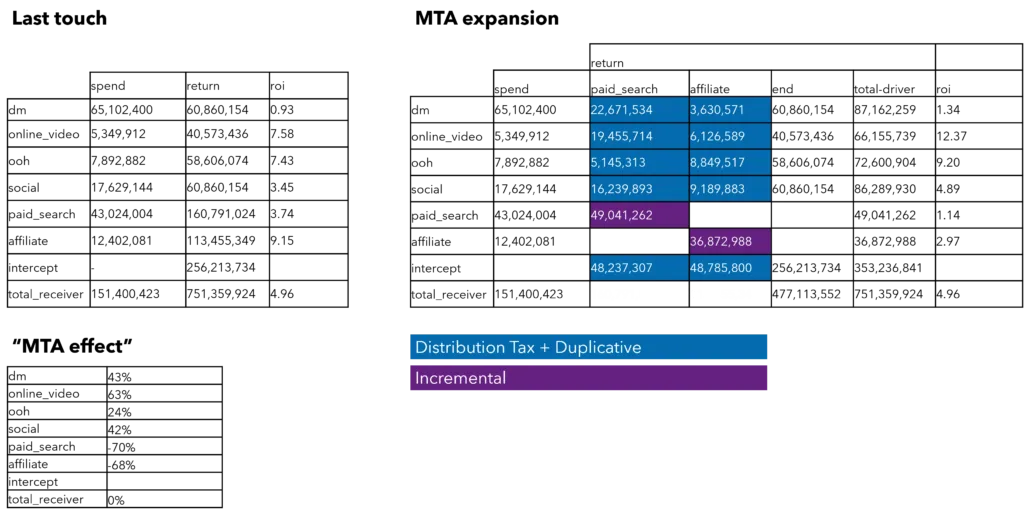
Reactive planning (or adjustment) happens constantly. Marketing dashboards typically start with last-touch results. They become far more powerful when positioned side-by-side with MTA results. Channel managers who are used to seeing last touch CPAs will now see a mutually exclusive, collectively exhaustive view of CPAs, as well, that credits channels with “halo” if they drive more influence up the funnel. MTA is ideally suited for reactive adjustment because it can be built to update in near real time.

Figure 3: A last touch vs. MTA version of channel contribution. The “MTA effect” is the impact of multi-touch attribution on last touch CPAs. Some channels do better, and others look more expensive.
Final Thoughts on the MMM vs MTA Debate
In the debate of MMM vs MTA, the answer really is “both”. Both methodologies offer unique benefits and address different aspects of marketing effectiveness. The good news is that they can be built together, using one data pipeline. By understanding their strengths and limitations, marketing leaders can leverage MMM for strategic planning and MTA for tactical optimization and reactive adjustments. Combining both approaches—without throwing away last touch attribution—provides a holistic view of marketing performance, ensuring that every marketing dollar is spent effectively.

Download our whitepaper, “Measuring Marketing’s Effectiveness”
Access our whitepaper for a deep dive into additional imperatives and methods for CMOs and analytics teams driving measurable marketing ROI.


