Marketing leaders in financial services are navigating a long list of expectations: personalizing communication, improving acquisition performance, retaining customers, and demonstrating returns. And yet, for all the investment in technology and talk of “data-driven” strategies, many marketers still struggle to access the data they need to do the job well.
Customer Data Platforms (CDPs) were introduced to address the need for the comprehensive, multi-channel data necessary for modern marketing. For many organizations, these solutions provide helpful structure around audience segmentation and campaign targeting. But traditional CDPs are built with fixed logic. They assume a degree of centralization and integration that most financial institutions simply do not have – and often require marketers to adapt to the software, rather than the other way around.
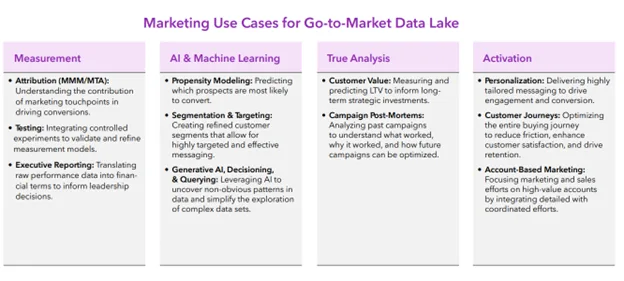
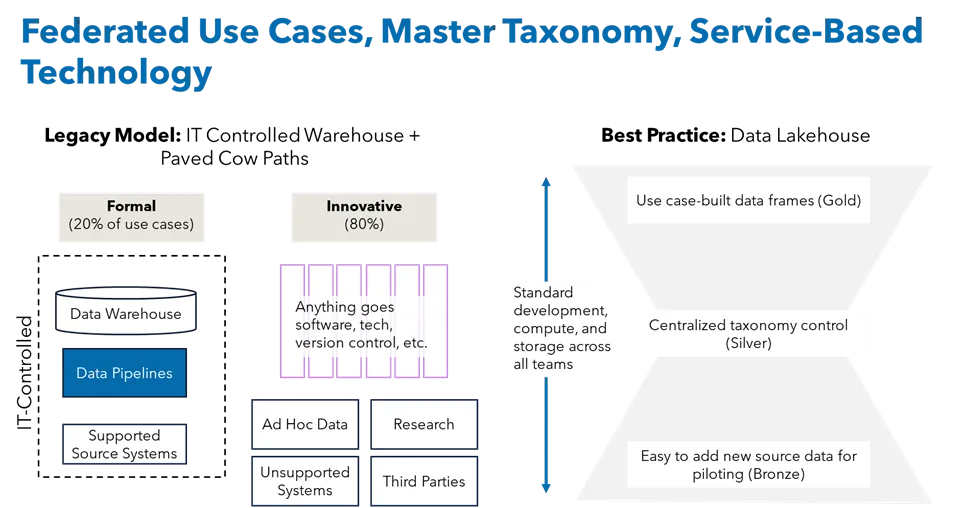
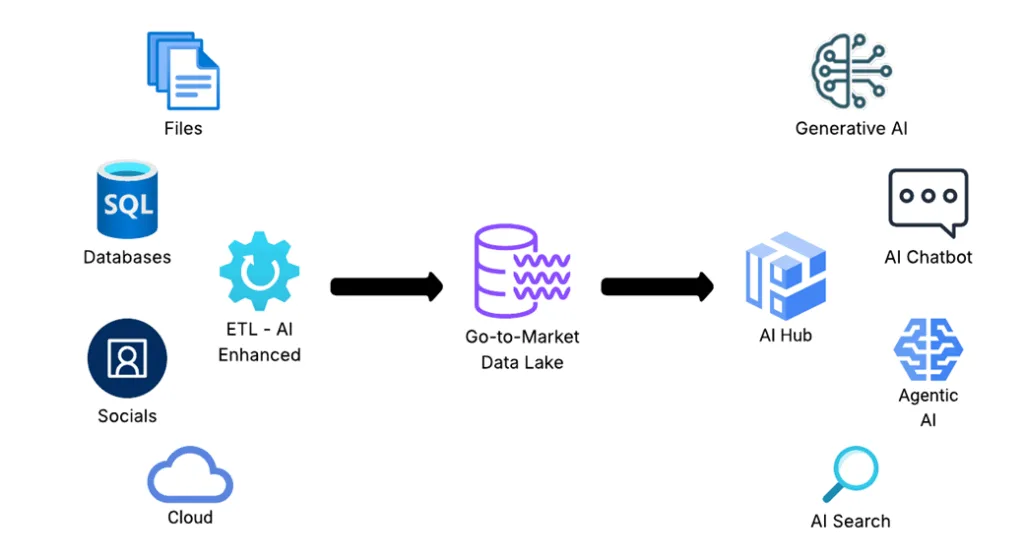
That’s why I believe composable CDPs (sometimes referred to as go-to-market data lakes) are a better fit. They allow marketing, analytics, and technology teams to assemble a flexible data foundation that works across existing systems. Instead of being forced into someone else’s box, you get to design the system around your own business needs. And in an industry with complex products, legacy infrastructure, and heightened regulatory expectations, flexibility matters.
Here are five ways a composable CDP can help:
1) Align Marketing, Analytics and Tech Around Shared Goals
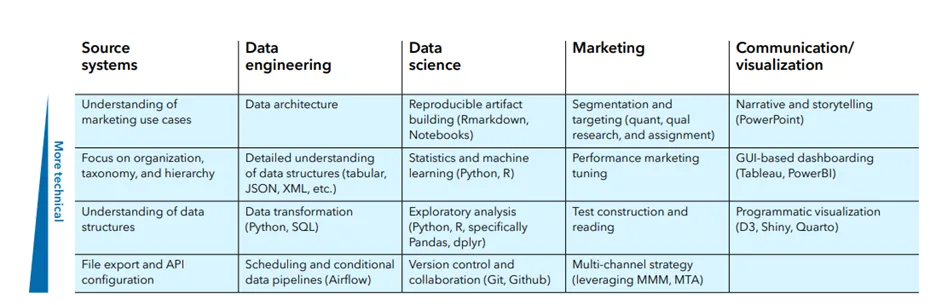
One of the biggest challenges I see in financial services is that marketing, analytics, and tech teams operate in their own ecosystems and still speak different languages. They’re doing good work, but often on different timelines, with different priorities and different definitions of success. Marketing focuses on strategy and outcomes, analytics is buried in reporting and data engineering, and tech is managing capabilities and infrastructure. When those groups aren’t working from a shared roadmap, priorities get misaligned quickly.
A composable architecture helps bring those teams together. When you organize around specific use cases – like onboarding new customers or identifying upsell opportunities in the advisor channel – it’s easier to stay aligned. Everyone understands what they’re building and why. That cuts down on back-and-forth, reduces wasted effort, and improves speed to market.
A composable architecture also helps reduce cost. Anyone who’s worked through multiple rounds of rework knows how expensive it can be to get it wrong. This approach minimizes that risk.
2) Tame Data Complexity from Mergers and Legacy Systems
Most financial institutions aren’t starting from a clean slate. They’ve grown through acquisitions. They manage multiple product lines and deliver through multiple distribution channels. And they often rely on infrastructure built over decades – which means customer data lives across dozens of antiquated systems, none of which were designed to talk to each other. Add in a wide range of state- or account-level variations and compliance requirements, and you’ve got a perfect storm.
Trying to shoehorn all of that into a single CDP can be painful and expensive. Composable CDPs work differently. They allow you to connect the systems you already have, extract what matters, and standardize the data just enough to activate it. You don’t have to rebuild everything. You can move forward with what’s useful and gradually evolve from there.
This is particularly helpful when you’re trying to deliver consistent experiences across business lines or channels that weren’t originally designed to coordinate. A composable approach makes that achievable.
3) Protect Customer Trust While Meeting Regulatory Demands
Another big reason this matters in financial services? Regulation. Privacy and compliance are non-negotiable and a marketing data strategy that doesn’t fully account for them will eventually fail – if not operationally, then reputationally.
A composable CDP can help on both fronts. It provides structure for managing consent preferences, documenting data lineage, and making sure sensitive data isn’t used out of context. It gives compliance teams the transparency they need, while still giving marketers the ability to move with speed.
You don’t have to choose between responsible data practices and effective marketing. With the right setup, you can do both.
4) Move Beyond Guesswork and Test Like Scientists
Many marketing teams want to build a culture of experimentation; however, in financial services, it can be a struggle to run tests that meet both business and regulatory standards. Whether you’re optimizing retirement planning campaigns or fine-tuning service reminders for lapsed policyholders, experimentation can feel risky without the right controls.
A composable CDP changes the game. It gives you access to real-time data across systems, supports test design, and makes it easier to track and optimize performance in a way that stands up to internal scrutiny. This doesn’t just improve outcomes – it improves credibility and trust with the rest of the business. When marketing shows up with results instead of opinions, it becomes easier to justify budget, ask for resources, and lead with confidence.
5) Scale Personalization That’s Actually Useful
Personalization is important, but only if it’s meaningful. Sending someone their first name in a subject line doesn’t move the needle. However, a needs-based approach that allows you to recognize that a young family is saving for college, or that a retiree is reevaluating their drawdown strategy, actually might.
A composable CDP helps you make that leap. It enables you to respond to intent-based behaviors, engagements, signals, and life events—so that you can serve the right message at the right time. And because it’s connected across systems, you’re not guessing. You’re making decisions based on what people are doing, not just who you think they are.
Done right, this builds trust. Customers begin to expect, and appreciate, that your outreach makes sense given their situation.
Getting a handle on this is 100% doable
I’ve worked in financial services long enough to know how hard all of this can be. The systems are fragmented. The expectations are high. And the time to show results is always shorter than anyone would like.
But I’ve also seen what’s possible when marketing, data and tech teams come together around a common strategy. Composable CDPs don’t eliminate the complexity, but they make it manageable. They provide the architecture to move faster, plan smarter and execute with greater clarity.
At Marketbridge, we help financial services organization build these kinds of systems. We’ve got both the technical and industry expertise to help connect strategy to architecture, marketing to analytics, and data to decisions.
If you’re navigating disjointed infrastructure, dealing with legacy or disparate systems, exploring how AI fits into your stack, or just trying to modernize the way your team operates, we’d be glad to share what we’ve learned. Let’s talk.

Download the whitepaper, “Building a composable go-to-market data stack”
Rethink your data foundation and lead the next era of AI-ready, insight-driven marketing.