Resource Type: Resource


Composable Customer Data Platform (CDP)

Composable Customer Data Platform (CDP)
A flexible, scientific, and scalable architecture that places modern cloud data infrastructure at the center of sales and marketing
Thank you for Downloading
Lorem ipsum dolor sit amet, consectetur adipiscing elit. Phasellus vel tincidunt turpis. Fusce tristique cursus malesuada. Pellentesque euismod nisi eget nunc sagittis ullamcorper. Duis vitae aliquet diam. Proin a blandit nisl.
Subscribe to Marketbridge Updates
Introduction: The single source of truth for the enterprise’s go-to-market activities
Over the past decade, the Customer Data Platform (CDP) has become a critical piece of marketing technology. The CDP seeks to provide a “360-degree view” of customers and prospects, promising a personalized experience that can drive revenue growth and retain customers. However, these platforms have struggled to deliver value beyond audience activation, and the market has reacted accordingly. ChiefMartec published their “The State of Martech 2025” report, and it revealed a major shift regarding CDPs. In the study, B2B and B2C companies were asked to identify the technology component at the center of their martech stack. The cloud data warehouse grew from 20.9% to 23.9% since 2024, and the CDP fell from 26.9% to 17.4%. This shift indicates that marketers increasingly favor modern cloud data warehouses over software-embedded CDPs.
A composable CDP is a modern, independent, and comprehensive marketing and sales database that can serve as the single source of truth for the enterprise’s go-to-market activities, something we often call the Go-to-Market Data Lake (GTMDL). The benefits of the data lakehouse architecture combined with a reproducible, scientific ethos create a use-case first solution that powers measurement, machine learning, AI capabilities, true analysis, and activation for marketing, sales, and customer experience.
What is a CDP?
A customer data platform (CDP) unifies customer data into persistent, person-level profiles that make data available to downstream marketing systems. Their goal is to create a “360-degree” view of the customer including profile information, demographics, purchase history, and engagement data that can be leveraged for ongoing marketing efforts. CDPs are typically integrated software modules within broader marketing platforms, enabling marketers to standardize customer identities and orchestrate data flows across web, email, online ads, SMS, and social marketing channels.
Quick links
What is a composable CDP and how is it different from a traditional CDP?
A composable CDP, or go-to-market data lake, has evolved in response to challenges that traditional CDPs faced and has several key differences:
- Decoupled architecture: Operates independently upstream from the marketing activation platform allowing greater flexibility and design to accommodate a broader range of use cases.
- Cloud-native infrastructure: Rather than being a commercial software product with a dedicated user interface; a composable CDP is built on a modern cloud data platform and functions more like infrastructure – allowing specialized tools and services to be layered on top.
- Design flexibility: Emphasizes design flexibility, cost efficiency, and simple scalability, making it easy to start small and expand linearly as successful use cases are built.
What are the limitations of traditional CDPs?
Traditional CDPs are optimized for speed and simplicity, and therefore make several important trade-offs that a buyer should consider:
- Data often needs to be cleansed and transformed before ingestion.
- The vendor controls the database layer, so your data model must adapt to pre-defined schemas. This makes it difficult to support custom business data entities.
- Advanced analytics use cases often require exporting data to a separate data warehouse, increasing complexity and cost.
- Pricing is typically based on the number of customer profiles managed, which can drive up costs for use cases that require larger data sets.
- Features and functionality are tied to vendor roadmaps, which may slow your ability to quickly pivot on new marketing strategies or channels.
Do composable CDPs provide more flexibility?
Yes, composable CDPs offer more flexibility in several ways:
- Data models can be designed to reflect your organization’s business logic, rather than adapting to a vendor’s predefined schemas.
- Supports a more modular approach to implement best-of-breed tools for ETL (extract-transform-load), identity resolution, audience building, reporting, and advanced analytics and machine learning.
- Can be provisioned quickly and cost-effectively, starting with a small use case and minimal upfront platform costs.
- Greater control over the costs as you scale by only paying for the compute resources based on actual usage.
- AI and machine learning capabilities can be built directly within the same data environment.
How do you know if a traditional CDP or a composable CDP is a better fit for the organization?
Composable CDPs are especially valuable for organizations with complex data needs, diverse marketing channels, and a need to go beyond channel-level activation and reporting. If your marketing relies primarily on direct-to-consumer online selling with well-structured first-party website data, email, and digital advertising, then a traditional CDP may be sufficient.
However, a composable CDP is often a better choice when:
- You need to measure and activate across difficult-to-track channels such as TV, radio, billboard, direct mail, earned media, organic social, and other offline sources.
- Your marketing campaigns use custom data sources that require significant cleansing and transformation. This may include spreadsheets, product data, finance data, or customer service-related data.
- You require advanced techniques for customer acquisition and retention, segmentation, or predictive analytics.
- Your business sells through multiple distribution channels (direct, resellers, distributors, etc.).
Where do composable CDPs fit into the marketing tech stack?
Composable CDPs sit upstream from customer experience platforms and marketing automation platforms that deliver content via web, email, and ad networks. They serve as the single source of truth for analyzing, modeling, and curating customer or account lists, which are pushed downstream to activation systems.
Digital engagement and purchase data generated by activation systems is fed back into the composable CDP for reporting and analysis. This closed-loop architecture enables a continuous improvement of marketing strategies.
>Do composable CDPs integrate with other tools in the marketing tech stack?
Yes, major modern marketing platforms support robust integration with composable CDPs through connectors, APIs, and native data sharing features. Additionally, third-party tools like Fivetran and Rivery are available that can make the job of interconnecting data and marketing systems easier through well-structured and controlled schemas.
What are the leading composable CDP data platforms?
Leading composable CDP infrastructure includes Databricks, Snowflake, AWS Redshift, and Azure Synapse. Each of these offer scalable storage and compute, advanced analytics capabilities, and enterprise class security features.
Organizations should carefully consider platforms that have already been adopted within their corporate IT ecosystem to reduce onboarding time and leverage existing security and compliance frameworks.
How long do they take to implement?
The timeline for implementing a composable CDP varies based on the organization’s data maturity, existing vendor relationships, and complexity of the initial use case. For companies with a well-defined use case and accessible data, a solution can be deployed within three months. This initial phase includes aligning the stakeholders, integrating data sources, building data pipelines, and creating consumable data output. However, common roadblocks such as security and compliance approvals, vendor onboarding, and sourcing data can extend the timeline. Organizations that encounter these hurdles may require 3-6 months to complete implementation.
What are the cost considerations for a composable CDP vs traditional CDP?
There are 2 key costs to consider:
- Resources Costs to staff a traditional vs. composable are similar. A composable CDP is operated by a data engineer who can build tables and views, data pipelines, and output. A traditional CDP requires a marketing operations role to be trained on the platform to ingest data and build audiences. CDPs promise marketers self-service capabilities, but non-technical marketing users often hit roadblocks when dealing with unclean data.
- Licensing
Traditional CDPs have high upfront software investments and typically require long-term agreements and implementation fees. There are also ongoing fees based on the number of customer or account profiles managed within the system.
Composable CDPs have low upfront platform fees, no required commitments, and the flexibility to scale as workloads are increased. The main cost with a composable CDP is compute time for processing. Data storage is another cost but is relatively inexpensive.
What AI and Machine Learning use cases are enabled by a composable data stack?
Big data advanced analytics
A composable CDP enables the processing of very large data sets up to billions of rows in a cost-efficient way. This is useful for analyzing digital activities like advertising impressions, web activity, and other digital engagements to develop customer attribution models, trend analysis, and behavioral analytics.
Rich data tools
Composable CDPs have support for first-class data science toolkits including runtime support for Python and R, and Data Science Notebooks. These can be used to develop and train various types of machine learning models.
Sentiment analysis
Composable CDPs have LLM functions built into the data layer. This enables processing of unstructured data such as text and documents for use cases like classification and sentiment analysis.
What KPIs should be established to evaluate CDP success?
The best way to prove ROI with a Composable CDP is by building a series of marketing effectiveness metrics that provide visibility into the effect that marketing dollars have on sales.
- Customer lifetime value: The total revenue expected from a customer over the duration of the relationship with your company.
- Customer acquisition cost: The average cost incurred to acquire a new customer.
- Net retention rate: The percentage of recurring revenue retained from existing customers over a defined period of time.
- Channel ROI: Return on investment for a particular marketing channel, showing how much revenue is generated for each dollar spent.
- Incremental lift: Additional sales or conversions directly attributable to specific marketing activities, above what would have occurred without it.
These measures empower growth leaders to make better strategic decisions, justify budget allocations, and prove the impact that marketing efforts have toward broader business goals.
Ready to talk about building a composable CDP? Reach out!
Featured insights


Subscribe to our newsletter
Fresh and new thinking from our experienced team of marketing strategists, data scientists, and statisticians on trends, methods, and industry use cases in Go-to-Market.
Unified Marketing Measurement

Unified Marketing Measurement
An approach that combines MMM, MTA, and testing into one system for measuring marketing effectiveness
Thank you for Downloading
Lorem ipsum dolor sit amet, consectetur adipiscing elit. Phasellus vel tincidunt turpis. Fusce tristique cursus malesuada. Pellentesque euismod nisi eget nunc sagittis ullamcorper. Duis vitae aliquet diam. Proin a blandit nisl.
Subscribe to Marketbridge Updates
Introduction: Long-run impact, meet real-time insights
Traditionally, last-touch, MMM, MTA, and testing results were all used to separately measure marketing’s effectiveness. While each approach had its advantages (and limitations), they seldom agreed, leading to frustration.
Unified Marketing Measurement (UMM) integrates incrementality testing, marketing mix modeling, and multi-touch attribution into a single, reproducible and holistic system built on a near-real-time longitudinal human record (LHR) inside a composable marketing data lake.
For brands and companies that have not started with marketing effectiveness, starting with a UMM approach saves future model integration headaches, and isn’t much more difficult than standing up an MTA or MMM on their own.
What is UMM and how does it differ from traditional MMM or MTA?
Unified Marketing Measurement integrates econometric analysis (marketing mix modeling or MMM), behavioral customer analysis (multi-touch attribution or MTA), and in-market incrementality testing to drive a consistent picture of marketing effectiveness. UMM’s holistic view of marketing performance provides the single source of truth business’ want to make faster, more accurate decisions. Typically, it also is more ambitious in scope, taking long-run brand effects, pricing, and distribution choices into account to paint a complete causal picture of revenue.
UMM is much faster than typical MMM, because econometric results are driven into an MTA-like longitudinal human (or account, in the case of B2B) record. At the same time, it does not suffer from “offline blindness” as does MTA.
Quick links
How does UMM deliver faster results?
UMM integrates real-time, record-level data from across the business’ go-to-market functions into a composable data lake. This data connectivity enables daily re-estimates of each channel’s impact based on the most updated information using an MTA structure, while using MMM-generated coefficients and incrementality estimates.
What types of data does UMM integrate (e.g., media, sales, CRM, external factors)?
The best UMMs integrate a comprehensive set of stimulus data—anything that might drive sales (or whatever your dependent variables of interest is)—into a single unified system. These data typically include:- First- and third-party paid digital media touches, such as online video, connected TV, display and native advertising and paid search
- “Above the line” advertising, such as linear TV, audio, and out of home
- Earned media and PR
- CRM touches like email and direct mail
- Promotions
How does UMM handle cross-channel attribution?
Because UMMs look at all distribution channels—for example, retail, direct, and platform—they must take cannibalization into account (or, in rare cases, a beneficial effect.) In essence, when a channel like retail is added, this typical depresses sales through, say direct. Reach and price are the key drivers of this effect, but UMMs should give channel strategists what they need to make route-to-market decisions.How does UMM handle incrementality?
Incrementality should be the standard output of the UMM. In other words, each reported metric—such as ROAS (return on ad spend)—should (1) not be duplicative with any other stimulus channel, and, (2) should take the base, or “what would have happened without marketing”, into account. This can be a challenge with MTA solutions, which typically start with a sale and work backward to divvy up credit to the various channels that “touched” the sale, but UMM solutions solve for this by deriving causality from more sophisticated econometric (MMM) analyses.What modeling techniques are used?
UMMs rely on Bayesian regression for the MMM step, causal inference for the testing step, and machine learning techniques like logistic regression or Shapley values for the MTA step. Each solution uses slightly different methods, but the most important thing to look for is parsimony. Overly complex methods can easily create nice looking but incorrect results.How frequently is the model updated and refreshed?
The MMM component of a UMM, which is the main causal engine, is typically refreshed at three levels. First, daily contribution re-estimations can be accomplished easily without rebuilding coefficients. In essence, this means that each channel’s impact will change based on its spend and the sales observed, but the causal relationship between spend and return will not be updated.
Second, coefficients can be reupdated frequently as new data come in. This “mid-level” refresh uses the same model structure, but allows the causal “power” to change, between, say, paid social video and sales. This is a lighter lift and might be redefined weekly.
Finally, the overall model structure—which includes the taxonomy of stimulus channels and how they interact—is typically rearchitected quarterly.
The beauty of a UMM solution, however, is that the MTA component is updated in near real-time. While the causal inputs might not change as frequently, a CMO should be able to understand marketing’s performance on any given day.
How does UMM integrate with our existing tech stack (BI tools, CDPs, cloud platforms)?
UMM models should sit on top of an owned marketing data lake that takes inputs via API from martech tools and CDPs, but should not exist inside these tools. Martech tools are inherently siloed—even if vendors claim to have a comprehensive view. Outputs can certainly be integrated into existing BI tools (like Looker or PowerBI).What is the onboarding process like, and how long does it take to be fully operational?
Universal Marketing Measurement is not software. It is a system and way of thinking for marketing analytics that includes data, people, models, processes, and reports, so “onboarding” is probably not the right way to think about. That being said, a UMM approach should start producing results within six months, and should be fully mature after about a year. A typical realistic timeline:- Months 0-3: Data lake built and starting to be hydrated; draft marketing mix model built; first tests designed
- Months 4-6: First “final” MMM model built; priors ingested from initial rounds of tests; draft MTA model built
- Months 7-9: First “final” MTA model built; priors ingested from MMM; initial real-time results flowing
- Months 10-12: Results tuning; testing “factory” up and running; real-time results embedded in marketing and financial dashboard for the company
Can UMM handle both online and offline data sources?
UMM is tailor-fit to handle both online and offline data sources. Because the MMM portion can estimate any stimulus impact due to its use of econometric time series analysis, all marketing touches’ impacts are estimated. Offline touches are then probabilistically imputed into the MTA portion to get a real-time view of impact. Tests are also perfect for measuring offline impact. For example, geographical tests with synthetic controls can be used to measure the incremental impact of almost anything—and these results can then be imported into the MMM and ultimately the MTA component to understand impact.How does UMM quantify marketing ROI across channels and campaigns?
Because UMM calculates ROI at the individual level (whether a new customer, won deal, or sale), it is relatively straightforward to calculate return on any dimension. A well designed and enforced taxonomy is critical, of course. Concretely, say we wanted to calculate ROI for the Social-Video channel. We would sum the incremental contribution (in dollars of revenue or profit) of Social-Video across the timeframe of interest, and then crosswalk back to the promotional table for each of the attributed Social-Video part-worths to understand working dollar spend that drove these part-worths. At this point, ROI can be attained by dividing contribution by spend. These calculations can be scaled across the entire dimensionality of stimulus and response—including channel, campaign, product line, content, and basically any other relevant cross-section or categorical variable.Can UMM simulate budget reallocation scenarios or forecast outcomes?
UMM can provide scenario functionality just like a traditional MMM, leveraging the econometric (MMM) layer of the solution. This includes optimizing budgets for a given objective function and a set of constraints.
Forecasting functionality is best handled with the record-level layer. Because each touch has a probabilistic impact and a time component, it is possible to build future forecasts as a “layer cake” of each likely conversion, by day, based on marketing plans.
Why Marketbridge for UMM
Recognized as a notable vendor in Forrester’s “Marketing Measurement and Optimization Services Landscape, Q3 2025,” marketers choose Marketbridge because we deliver transparent, custom-built measurement solutions that solve for complex channels, brand effects, and speed-to-insight—built inside their own environment.
More on marketing measurement


Subscribe to our newsletter
Fresh and new thinking from our experienced team of marketing strategists, data scientists, and statisticians on trends, methods, and industry use cases in Go-to-Market.
CMO’s guide to needs-based marketing
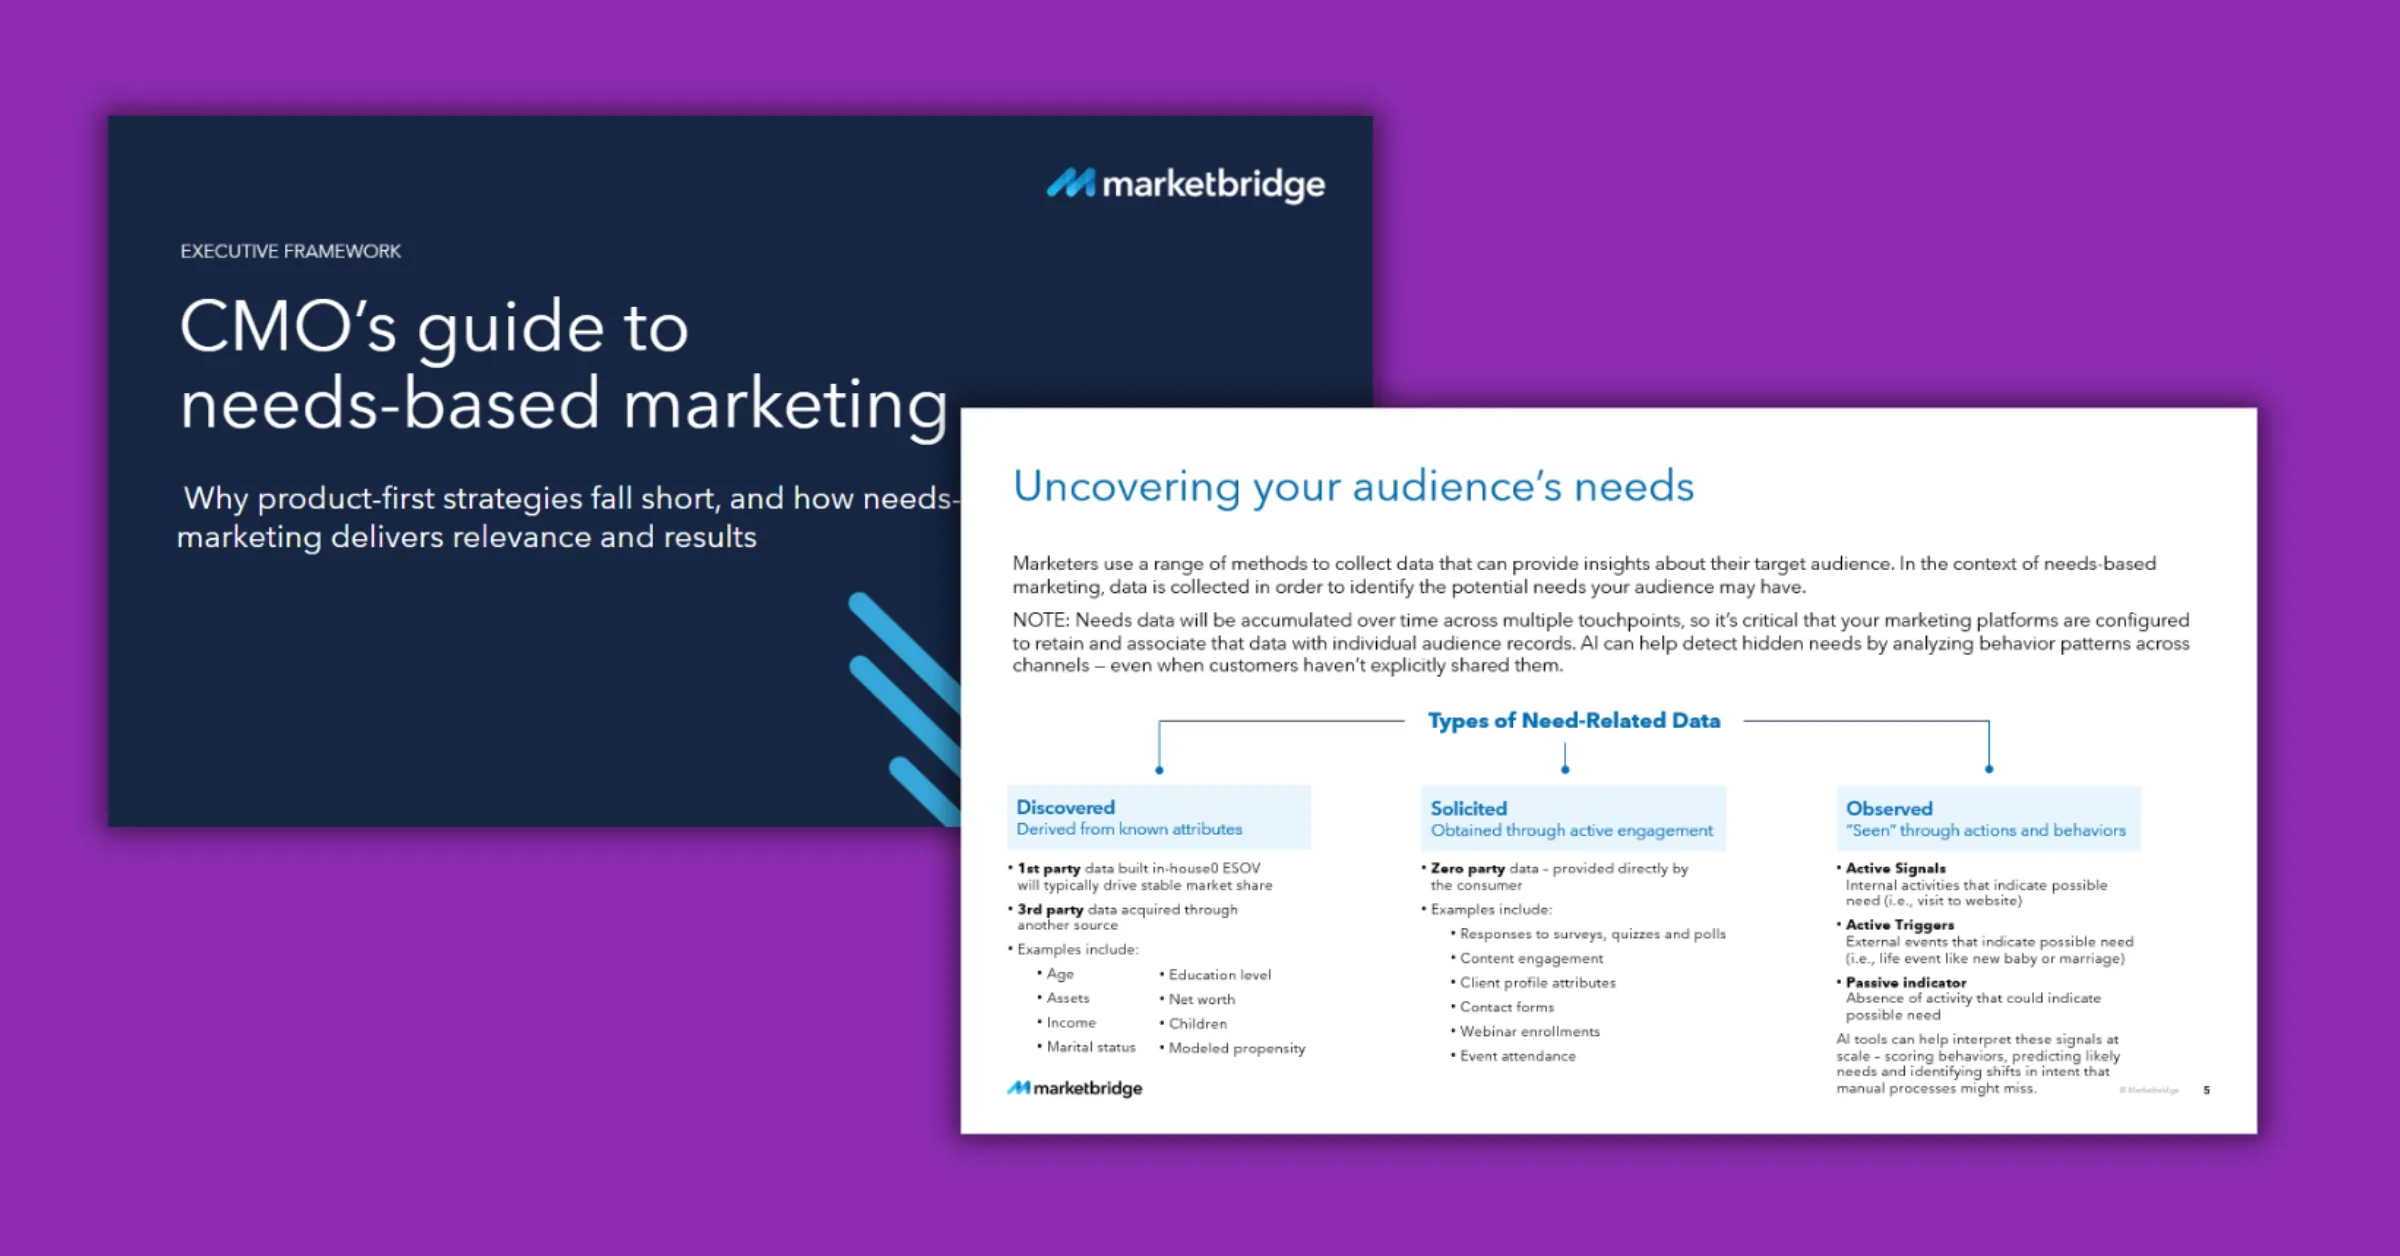
CMO’s guide to needs-based marketing
Why product-first strategies fall short and how needs-based marketing delivers relevance and results
Marketers are under pressure to create more relevant, personalized experiences. Too often, the focus begins with the product instead of the buyer. Needs-based marketing offers a smarter approach by prioritizing customer needs, supported by AI, and activated through automation. This guide uncovers evolving motivations and helps align strategy and content with intent, ultimately creating more relevant journeys that lead buyers to the right solution at the right time.
Download the guide to learn how to:
- Anticipate and uncover real customer needs beyond demographics and personas
- Leverage AI and automation to detect needs earlier and scale more flexible, and personalized journeys
- Introduce product messaging at the right time,not every time
- Build internal alignment for a needs-first approach across teams
- Deliver content aligned to evolving motivations and behaviors
What’s next?
5 B2B marketing trends you need to know in 2025
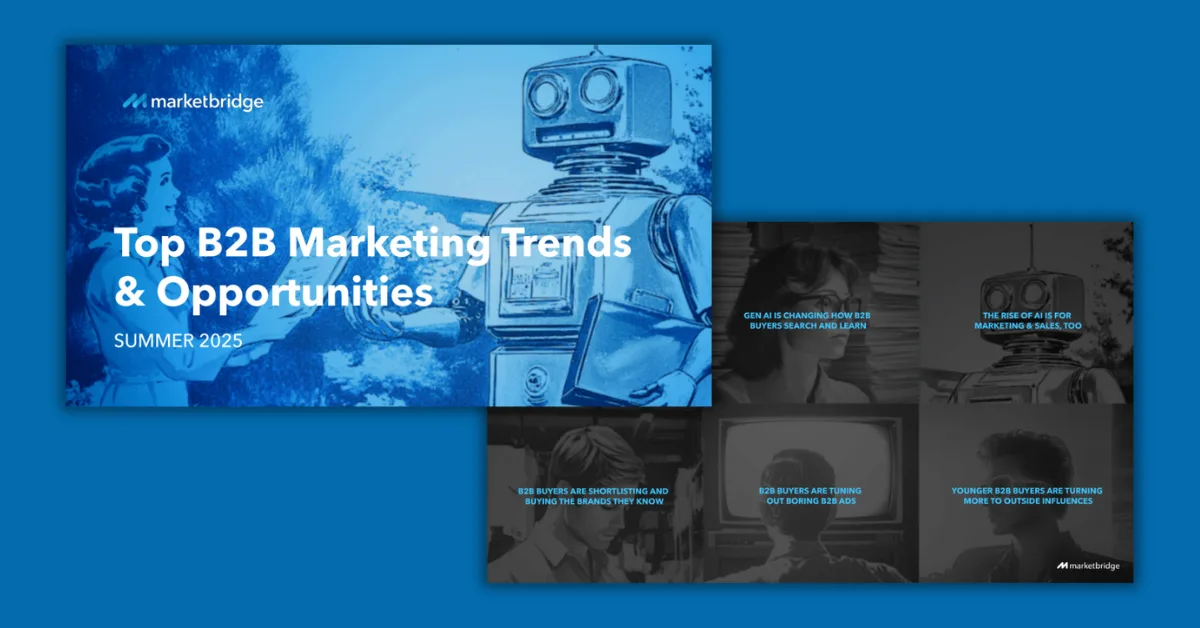
5 B2B marketing trends you need to know in 2025
From seismic shifts in B2B purchase behavior to the rise of GenAI, we’re in a time of massive change, for B2B buyers and marketing leaders alike. Those looking to win simply can’t afford to stand still.
Our expert agency team has their eye on the biggest trends shaping the future of B2B, and they’ve been taking notes. Explore our latest guide—no form required—for five key trends every B2B leader should know, plus actionable tips to stay ahead.
With trends ranging from GenAI to creative design to influencers in B2B, this will help you stay ahead for the rest of 2025.
GenAI is changing how B2B buyers search and learn
Read articleB2B buyers are tuning out boring B2B ads
Read article2025 marketing strategy benchmarks
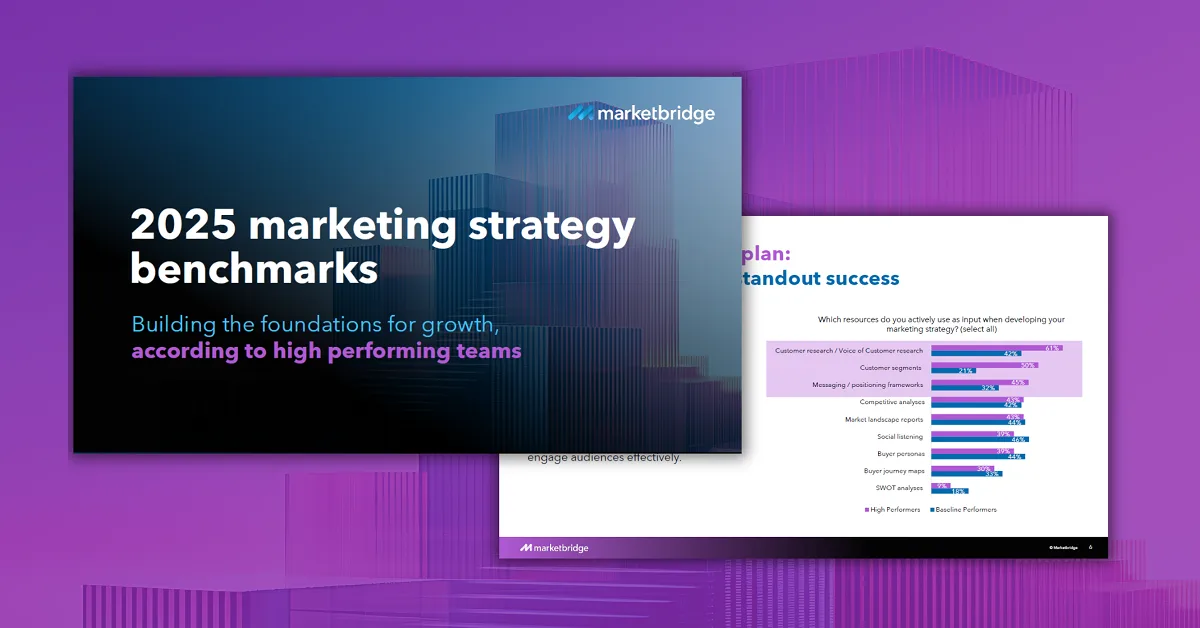
2025 marketing strategy benchmarks
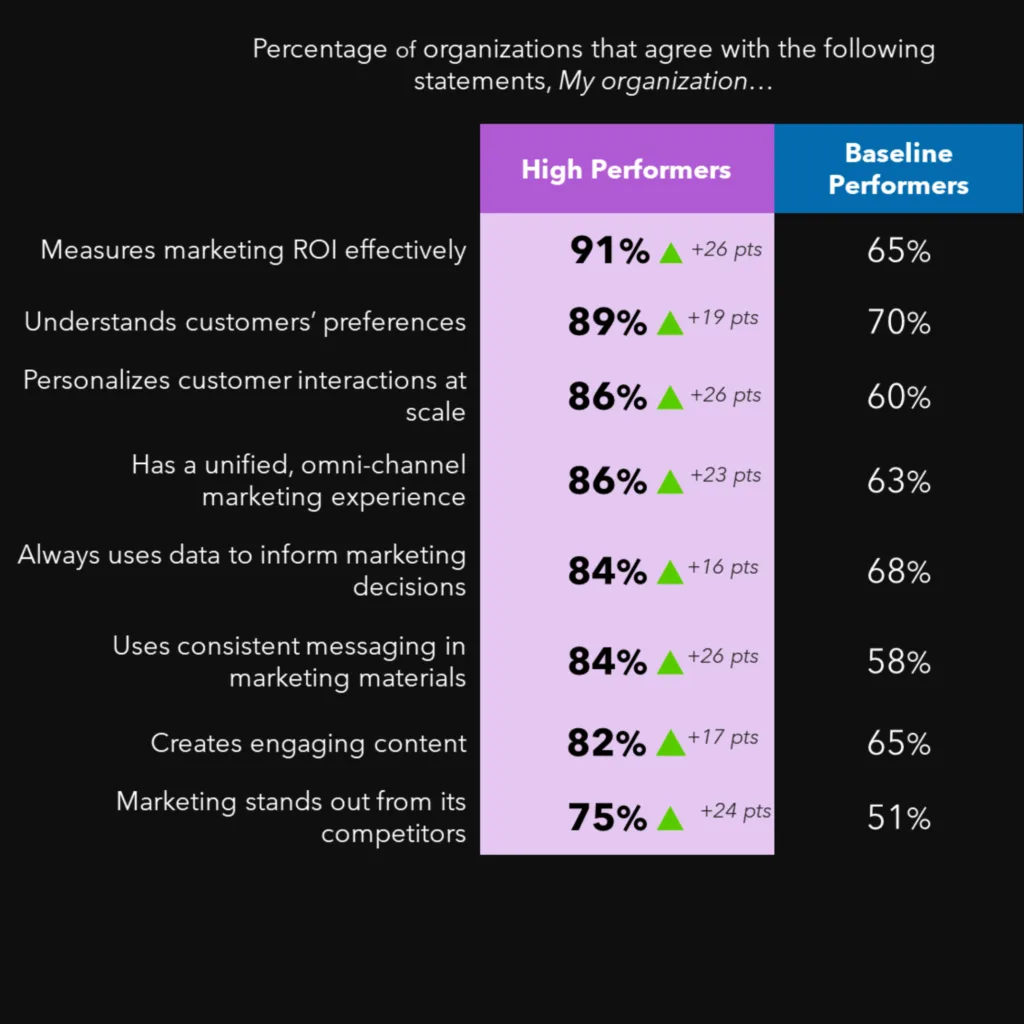
High-performing marketing teams build smarter strategies from the start
What separates leading marketing teams from the rest? It’s not just bigger budgets—it’s sharper thinking, deeper audience insights, and more disciplined planning. This report uncovers the mindset, strategies, and investments that drive marketing success, based on our annual survey of marketing leaders across industries. Designed for CMOs and senior marketers, the marketing strategy benchmarks offers a data-backed roadmap to build stronger, more scalable go-to-market strategies in 2025.
Insights for more effective marketing strategies
Whether you’re building next year’s marketing plan or realigning in-flight efforts, this report offers clear, actionable guidance to move from reactive to revenue-driving.
This report covers
- What high-performing marketing teams do differently
- How they plan, prioritize, and operate for impact
- Where they focus across the funnel—and what’s underutilized
- How they allocate budget and adopt new technologies like AI
- Clear next steps to help your team keep up—and catch up
What’s next?
The state of healthcare digital CX
The state of healthcare digital CX
Select insights from the report:
- Digital enrollment must boost member confidence: Consumers who work with agents report about 23% higher enrollment satisfaction compared to those who enroll without an agent.
- Pharmacy BOPIS usage is 22% across segments: Group members use ‘buy online purchase in-store’ the most at 26%.
- Health insurers trail other insurers in using email to communicate with members: 58% of consumers with homeowners’ insurance said email was a top communication channel from their insurer vs. 49% for those with medical health insurance.
Unlock key insights for CX success
Download “The state of healthcare digital CX” report to explore how consumer expectations are reshaping payer and provider go-to-market strategies and discover how to navigate today’s rapidly evolving CX landscape.
How consumer expectations are reshaping payer and provider go-to-market strategies
Digital expectations, rapid technological advancements, and changing regulations are reshaping how consumers buy health insurance and access healthcare. Today’s consumers demand seamless, personalized, and digitally integrated experiences, driving payers and providers to evolve or risk falling further behind.
We surveyed 1,000+ privately insured individuals (across ACA, Group, and Medicare Advantage plans) to uncover key CX trends across three areas:
- Purchasing health insurance
- Accessing healthcare services
- Engaging in health and wellness activities
Within each area, we highlight survey findings, strategic implications and provide actionable insights to help payers and providers refine their CX strategies and boost engagement in today’s increasingly digital and consumer-driven market.
What’s next?
2025 B2B sales benchmarks
2025 B2B sales benchmarks
Select insights
- 33% of high-growth companies set targets based on opportunity potential rather than existing revenue.
- Growth leaders employ documented, long-term growth plans and segment-specific strategies while aligning closely with marketing teams
- Leading sales teams operate with an average of three customer segments compared to two or fewer for lower performers.
- Industry-specific targeting and account ownership strategies drive greater efficiency, with single account ownership boosting ACVs by 40% compared to hunter-farmer models.
- Growth leaders align sales compensation with strategy, ensuring motivation and clarity of focus.
Whether you’re looking to optimize sales operations, align your team with strategic goals, or unlock the next level of performance, this report offers the clarity and direction needed to succeed in an increasingly competitive B2B SaaS landscape.
High-growth sales teams don’t just execute better—they think differently
What drives B2B SaaS sales teams to outpace their peers and achieve 20%+ YoY revenue growth? They’re not just working harder—they’re approaching sales with smarter strategies and tighter alignment. This first edition of our annual survey uncovers the mindset, tactics, and structures that set these high-growth leaders apart. Designed for sales leaders and CROs, it provides a clear roadmap to evaluate and activate growth opportunities with precision.
This report covers
- Key differences between sales team archetypes: Steady Builders, Market Contenders, and Growth Leaders
- Essential attributes of high-performing sales organizations
- Building blocks to advance to the next level of growth
- Five priority actions for sales leaders heading into 2025
What’s next?
The impact of AI on go-to-market strategies, programs, and investments
The impact of AI on go-to-market strategies, programs, and investments
Select insights
- 60% of respondents believe changing “Competitive Landscape” is the top area of expected disruption.
- Over 54% of respondents recognize the urgency to explore new growth opportunities and fund these initiatives more swiftly due to the rapid pace of AI innovation.
- 58% of respondents predict the most significant change in selecting channels and routes to market.
- While all leaders recognized the need for substantial investment requirements, not all agreed on where.
Research and insights from high tech market leaders
Generative AI (GenAI) is beginning to revolutionize sales and marketing by enabling highly personalized customer interactions, automating complex processes, and providing deep data-driven insights. To explore this further, we surveyed high tech market leaders. The resulting insights can help inform the future of marketing and sales motions—and where to place investments to deliver more effective and efficient Go-to-Market (GTM) strategies—in the age of AI.
This report covers
- Top areas of expected AI disruption
- Timeframe for adapting new GTM models
- Most promising areas for GTM disruption
- Reimagining jobs to be done within marketing, sales, and strategy
- Key inputs needed to optimize GTM performance in the AI era
- Delivering on the promise—top areas of investment needed
What’s next?
Build a more effective and durable revenue engine through customer success
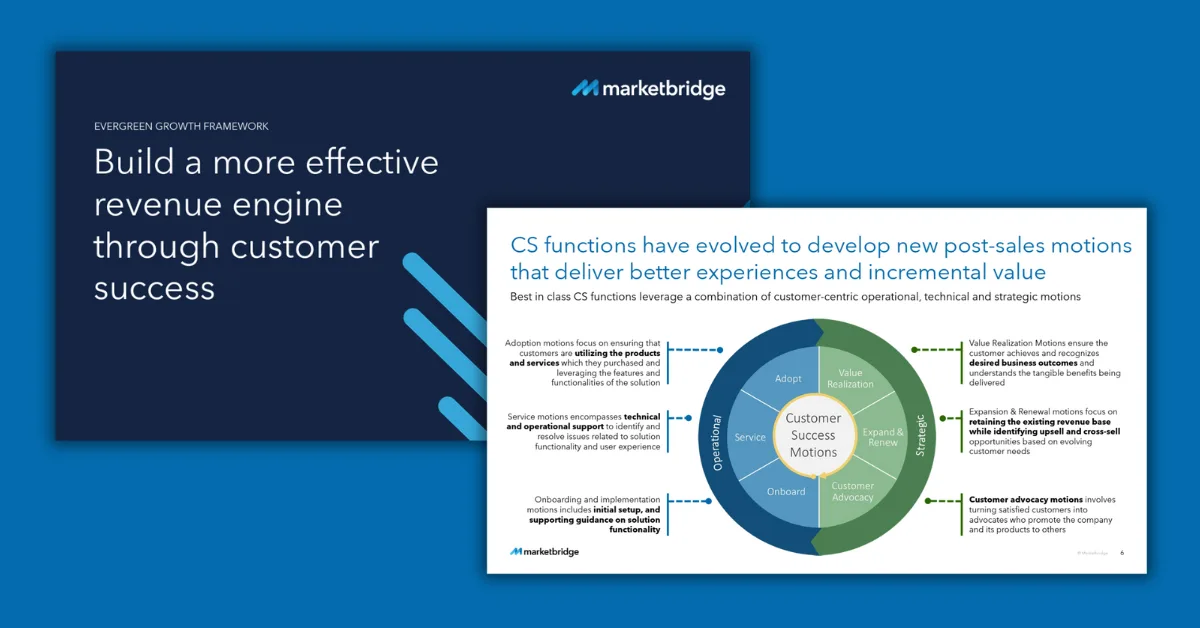
Build a more effective and durable revenue engine through customer success
Transform your customer success function into a powerful engine of growth
Customer Success (CS) has evolved from a reactive customer service role into a strategic imperative for B2B organizations. This marks a fundamental shift towards proactive engagement, focusing on developing enduring partnerships and driving mutual success.
That’s why we’ve developed an actionable approach to transform CS functions from cost centers into powerful engines of growth. By deeply integrating CS with strategic business objectives, companies enhance customer satisfaction and retention—as well as unlock new revenue opportunities through upselling, cross-selling, and strong customer advocacy.
Download the framework for all the details on transforming your CS function and get our checklist of six to-dos.